
YoY Growth Calculator
Accurate tracking for revenue, net income, or debt.
In the world of business and finance, we have made a very significant and important metric that you would see in almost any financial report or news update. Even if you are not deeply into the financial industry, you have likely heard people talking about YoY change or YoY growth. But what does this actually mean? Basically, YoY stands for “Year-over-Year,” and it is a way to look at what the growth or change is that you are seeing in a particular thing—like money, users, or debt—from one year to the next.
Using the YoY Growth Calculator
Our calculator is designed to be simple and accurate. Whether you are tracking revenue, net income, or even debt levels, you can use this tool to get an instant percentage.
You need to enter previous year’s value and current year’s value in our calculator above and it will automatically calculate the yoy growth rate for you.
1st Step: Your current value is 100 so you need to punch 100 under “Current Period Value”, you can check attached image,
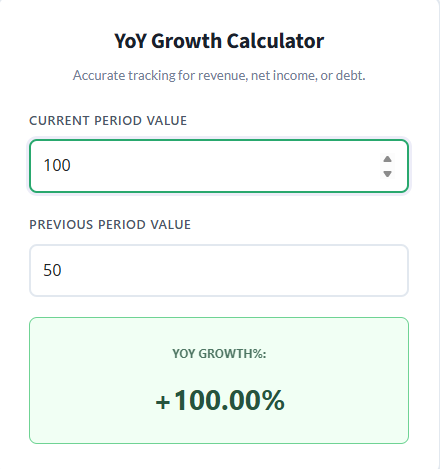
2nd Step: Suppose previous value is 50 so you need to enter 50 under “Previous Period Value”, as we have done in below image for your reference,
3rd Step: It will automatically calculates the yoy growth rate for you, say in our case it’s 100% growth rate which has been calculated by our tool.
Our tool beats in terms of negative items as well, as if your previous value was -50 and current value is -100, so its a negative change but many tools show it as a positive growth which is completely wrong. However, our tool will show it as negative (-100)% growth.
Understanding YoY with a Real-World Example
To understand this better, let’s take an example for more clarity and simplicity. Let’s say, for instance, you are running a business. We will call this Company ABC.
In the year 2024, Company ABC saw total revenues of around $100 million. As the business grew and they expanded their operations, their revenues for the year 2025 came in at $200 million.
When you plug these numbers into the YoY calculator, you will see that there is almost a 100% YoY growth for this company. This tells a very clear story: their revenues have increased by 100% within a single year. It is much easier to tell an investor “we grew by 100%” than to just list out the raw dollar amounts, because the percentage gives immediate context to the scale of the success.
Why YoY Growth is an Important Metric?
YoY growth or YoY percent change is considered one of the most significant metrics in both the financial industry and non-financial sectors. In fact, many experts consider it the gold standard for measuring performance.
You might ask, why not just look at month-over-month (MoM) or quarter-over-quarter (QoQ) data? While those are useful for short-term tracking, they often fail because they don’t account for seasonality.
The Impact of Seasonality
Seasonality is a huge factor in data that can lead to wrong assumptions. Let’s look at the retail industry as an example. During the Christmas season and the holiday holidays, retail companies usually experience a very massive exchange in their sales. Their numbers go through the roof in December.
If you look at their month-on-month growth in January, the numbers will look terrible. It might look like the business is failing because January sales are much lower than December sales. But this is just the “holiday impact.”
This is where YoY has a very good edge over other metrics. When you use a YoY calculator, you are comparing this December to last December, or this January to last January. Because both periods have the same seasonal factors, the “noise” is removed from the data. You get to see the true performance of the business without being distracted by the usual holiday ups and downs.
How the Mathematical Formula Works
If you wanted to check the numbers yourself or know the mathematical formula for Year-over-Year growth, there are two main ways to look at it.
The Standard Formula
The most direct way to calculate the growth for any segmental line item is:
$$\text{YoY Growth} = \left( \frac{\text{Current Value}}{\text{Previous Value}} \right) – 1$$
The Percentage Change Formula
Another way to calculate the YoY change, which is what our calculator uses to give you a percentage, is:
$$\text{YoY Growth \%} = \left( \frac{\text{Current Value} – \text{Previous Value}}{\text{Previous Value}} \right) \times 100$$
Step-by-Step Breakdown
If you are doing this manually, follow these steps:
- Subtract the last year’s number (the previous period) from this year’s number (the current period).
- Divide that particular number by the last year’s number.
- Multiply the resulting number by 100 to get the final percentage change.
Using these steps, you will be able to calculate the year-over-year growth for any particular segment or any particular payment term you are targeting.
Why YoY Matters to Investors and Stakeholders
When someone in the financial industry is talking about a change, they usually prefer to discuss percentages. They rarely just say that a value increased from 100 to 200. Instead, they tell the investors or stakeholders that there was a 100% change or a 10% change.
This makes it very easy for stakeholders to understand the growth of a business or a project. It tells a story about the business potential. If a company is showing a consistently good YoY growth rate, it makes it very clear that, going forward into the future, the company might have similar growth rates. It allows analysts to make assumptions that the company can at least match the growth they achieved in the previous year, assuming other factors remain constant. It tells a lot about the company’s potential and its future prospects.
Implementing YoY in Financial Models and Excel
For those working as financial analysts, corporate investors, or stakeholders, knowing how to implement these rates in a financial model is key. We have already discussed how the calculator works, but let’s look at how you would do this in an Excel file.
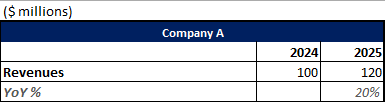
Imagine you are looking at Company A.
- In the year 2024, they have revenues of $100 million.
- In the year 2025, they have revenues of $120 million.
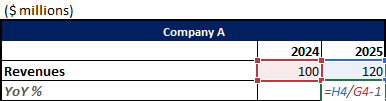
To find the YoY growth in Excel, you would select the cell for 2025 revenue, subtract the 2024 revenue cell, and divide by the 2024 revenue cell. This shows a 20% change.
Across various positions like financial analysts and investors, they prefer this YoY change because it helps them understand the business prospects. It is a standard part of any professional financial model used to evaluate if a company is a good investment or not.
Interpreting the Results: What do the numbers tell you?
Once you have the result from the YoY calculator, you need to interpret what it means for the business.
Positive Growth
If the change is coming out as a positive number (like +15% or +50%), it means there is clear growth. The company is gaining, and they are gaining in terms of their actual performance over a long period of time. This is generally what every business owner wants to see.
Negative Growth
If a negative number comes out—let’s say -10% or -50%—it is usually considered bad, but it does not necessarily mean the business is failing. You have to look at the context.
- It could be due to market-wide downturns where every company in the industry is struggling.
- It could be due to strategic restructuring, where the company is spending money now to grow later.
- It could be an economic impact that is affecting everyone.
However, if you are looking at an expense line item, a negative YoY is actually a great sign! It means the company is spending less than it did last year, which improves the bottom line.
The Base Effect
Sometimes the number might remain constant or neutral. This is often called the “base effect.” If last year was a very normal year and this year is also normal, your growth might look flat. It is important to compare your YoY results with other metrics to get the full picture of the business potential.
Conclusion
Using our YoY growth calculator allows you to analyze your data and take an analytical stand that is backed by metrics. Whether you are checking your own business revenues, looking at your personal expenses, or analyzing a giant corporation like Company ABC, YoY is the most reliable way to measure true performance.
It removes the noise of seasonality, helps you communicate clearly with investors, and gives you a realistic look at the future prospects of any financial line item. Bookmark this page and use our calculator whenever you need to see the real change in your data from year to year.
The tutorials, resources, financial models, and Excel templates provided by Finance With Logic are strictly for educational and informational purposes. They do not constitute professional financial, legal, tax, or investment advice. Financial forecasting involves inherent risks and assumptions. Please consult with a certified financial advisor, CPA, or registered broker before making any real-world investment decisions, executing trades, or finalizing corporate capital allocations based on these materials. Use of these models is at your own risk.
YoY growth rate stands for Year Over Year growth rate which tells what the growth or change is that you are seeing in a particular thing — from one year to the next.
The most direct way to calculate the growth for any segmental line item is:
$$\text{YoY Growth} = \left( \frac{\text{Current Value}}{\text{Previous Value}} \right) – 1$$
You need to enter initial value and current value in the calculator and hit submit to calculate the yoy growth rate.
Yes, as it is better than short term metrics and removes noise from the data.


Leave a Reply