
Forecasting a balance sheet in Excel is a fundamental skill for anyone involved in financial analysis, investment banking, or corporate finance. Not only do seasoned financial professionals rely on this expertise, but MBA students, business founders, and other stakeholders also benefit greatly from understanding how to project a company’s financial position. In today’s global business environment, the ability to forecast a balance sheet is critical for making informed decisions and strategic planning.
The Prerequisites: Income Statement First
Before forecasting or building the balance sheet, your financial model must have an income statement. Specifically, you need revenues, cost of goods sold (COGS), and gross profit. It is usually prefrred that you should have full Income statement ready with forecasting but in this case study we will be trying to focus more on balance sheet than Income Statement. So we will need revenues, cost of goods sold (COGS), and gross profit.
If you have not forecasted these yet, here is the basic approach using Microsoft as our case study (using historical data from 2022 to 2025 to forecast out to 2030):
Revenues: Assume the year-over-year (yoy) growth from 2025 remains the same until 2030. So, it makes it easy to forecast revenues for all forecasted periods.
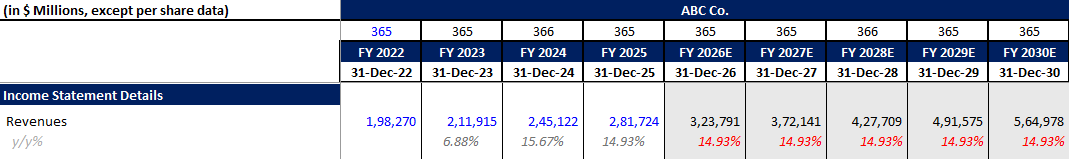
When forecasting revenues, you’ll need to decide on a YoY (Year-over-Year) growth rate. If you have your historical data ready, you can [use our free YoY Growth Calculator here] to quickly find your historical growth trend.
Gross Margin: Calculate historical gross margin and hold it constant from 2026 to 2030.
$$Gross\ Margin = \frac{Gross\ Profit}{Revenue}$$
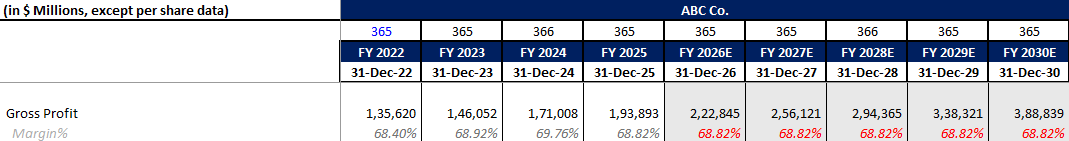
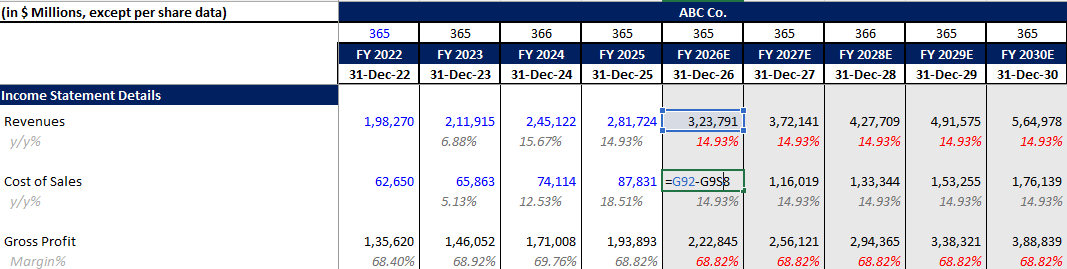
Gross Profit: Multiply the forecasted gross margin by your forecasted revenues.
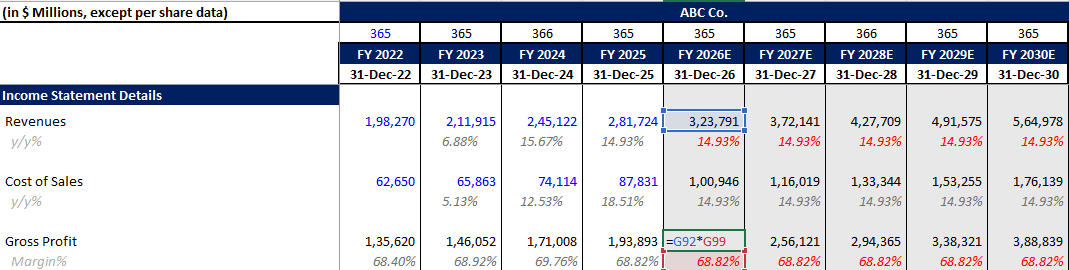
Cost of Goods Sold (COGS): Back-calculate COGS using the formula:
$$COGS = Revenue – Gross\ Profit$$
Once you have these major income statement line items, you can begin forecasting the balance sheet.
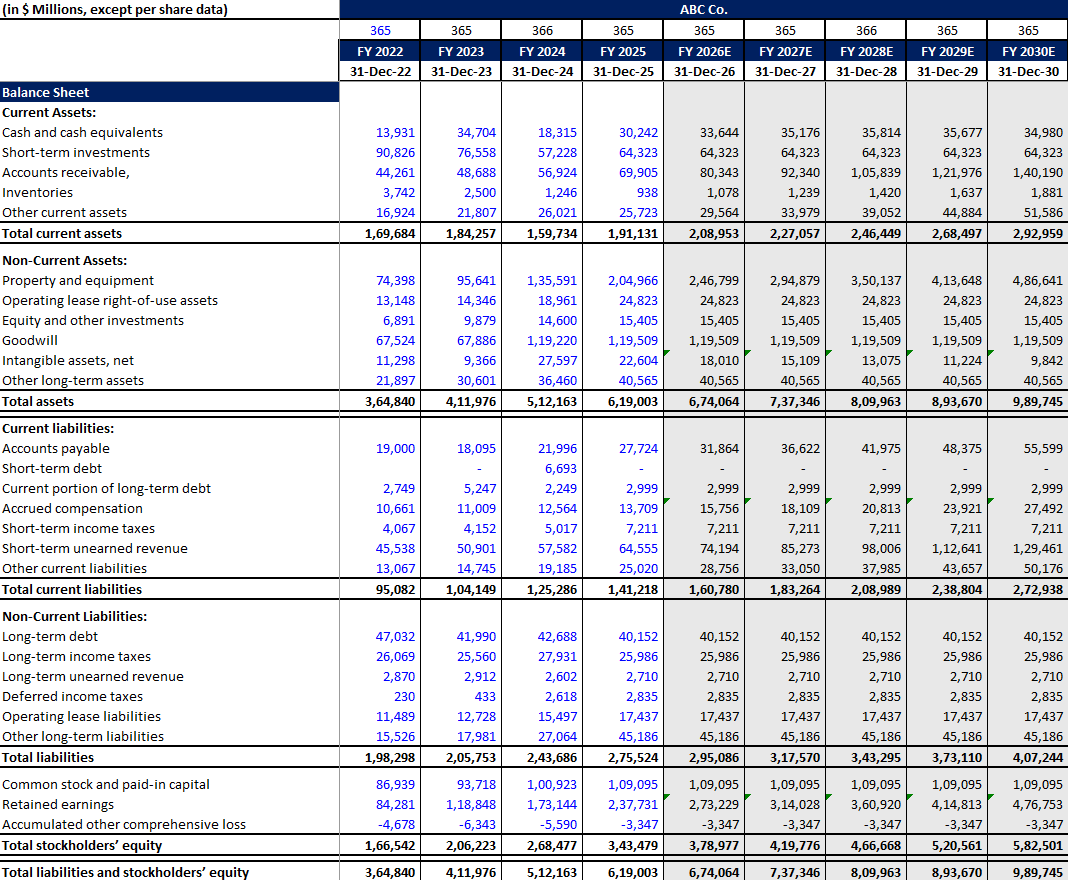
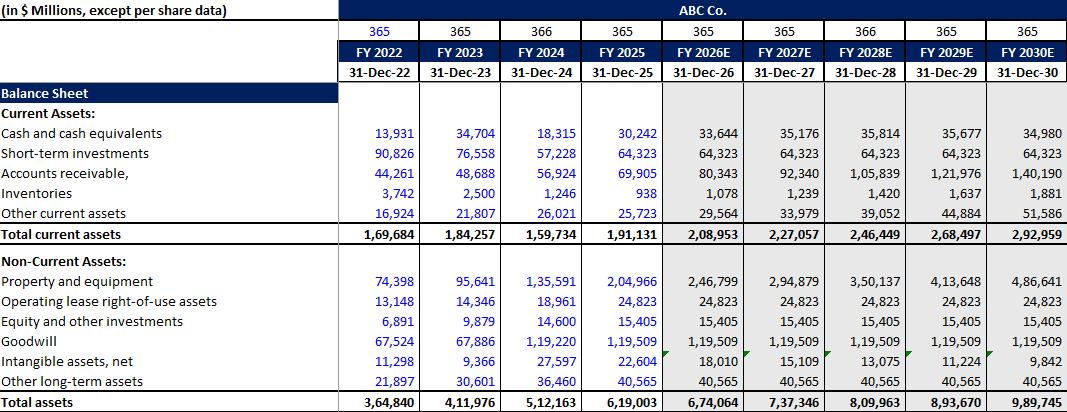
How to Forecast Balance Sheet Assets
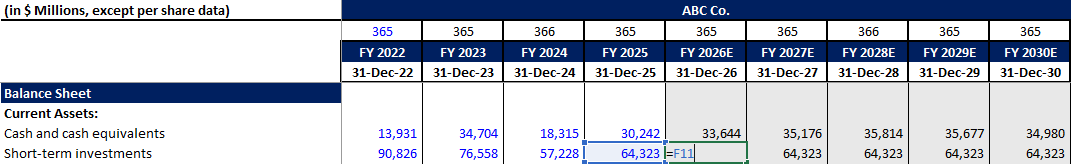
Short-Term Investments
Short-term investments (often known as marketable securities) are usually difficult to forecast. For our model, we consider them as constant from 2026 to 2030. This way your balance sheet looks not too complex and easy to understand by most of the financial analysts.
How to Forecast Accounts Receivable
Accounts receivable is calculated using the Days Sales Outstanding (DSO) number. First, calculate the historical DSO from your trade receivables data (2022 to 2025):
$$DSO = \left( \frac{Accounts\ Receivable}{Revenue} \right) \times 365$$
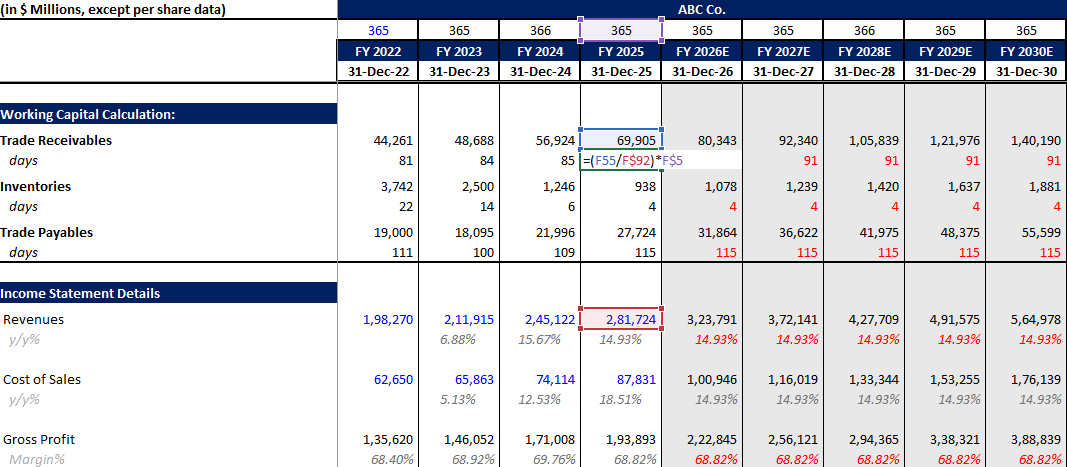
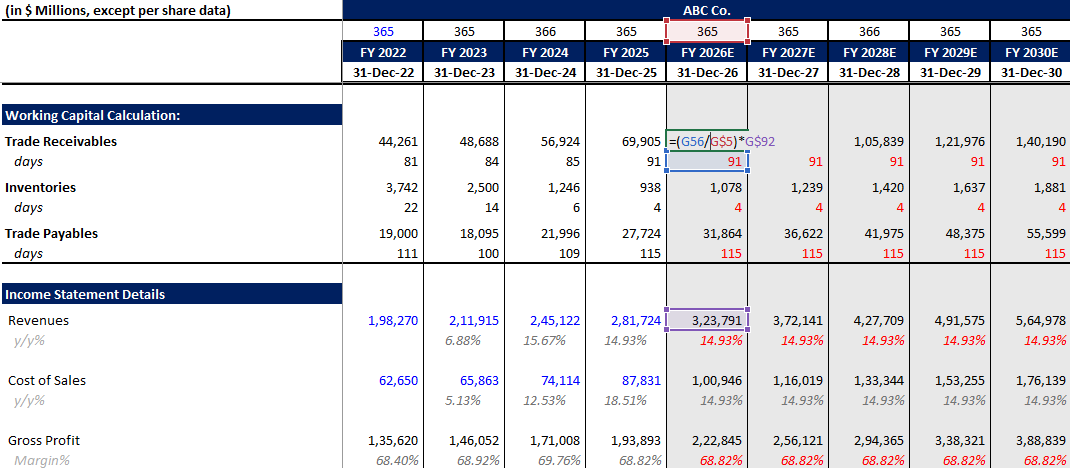
For simplicity, assume the 2025 DSO number (e.g., 91 days) remains the same for the forecasted periods. Then, back-calculate the forecasted trade receivables:
$$Forecasted\ Accounts\ Receivable = \left( \frac{Revenue}{365} \right) \times DSO$$
How to Forecast Inventory
Inventory is forecasted similarly to accounts receivable, but prices are calculated on cost of sales (COGS) rather than revenue. We use Days Inventory Outstanding (DIO):
$$DIO = \left( \frac{Inventory}{COGS} \right) \times 365$$
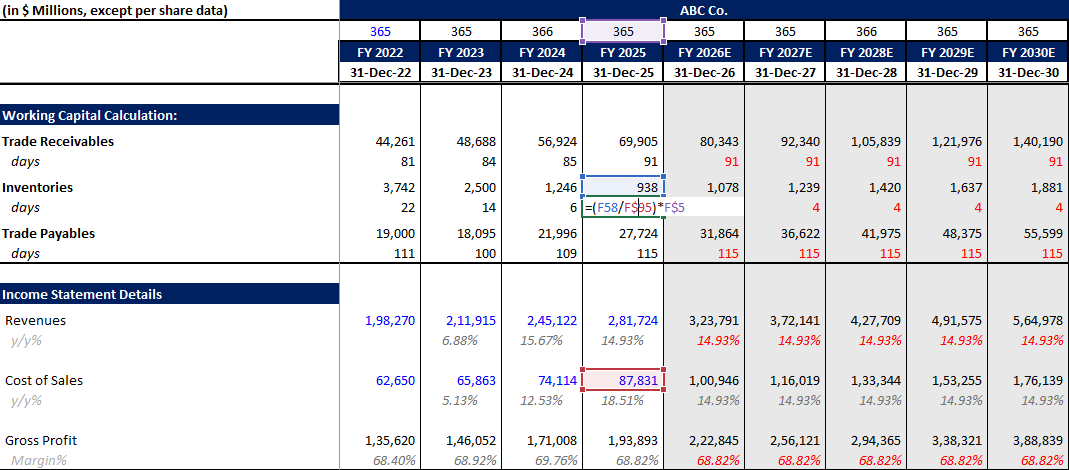
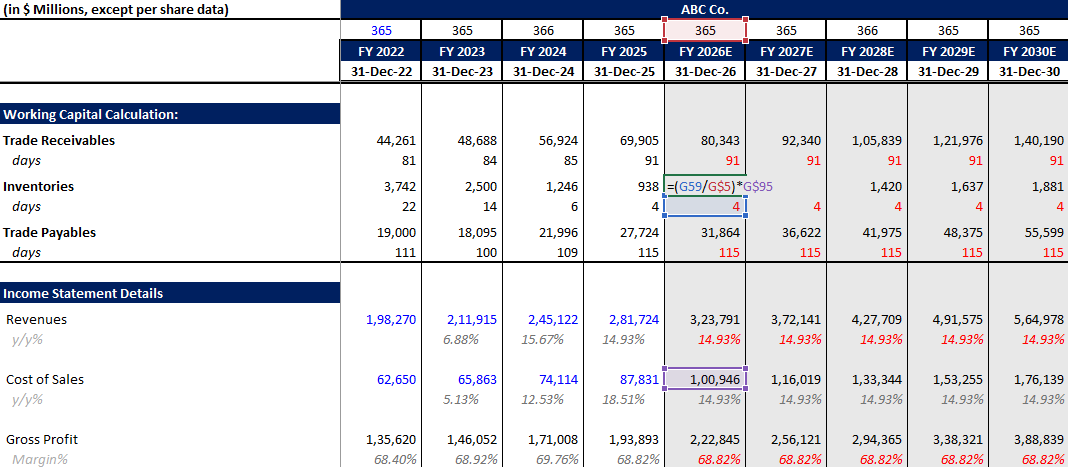
Assume the 2025 DIO number (e.g., 4 days) remains the same across forecasted periods. Back-calculate the inventory:
$$Forecasted\ Inventory = \left( \frac{COGS}{365} \right) \times DIO$$
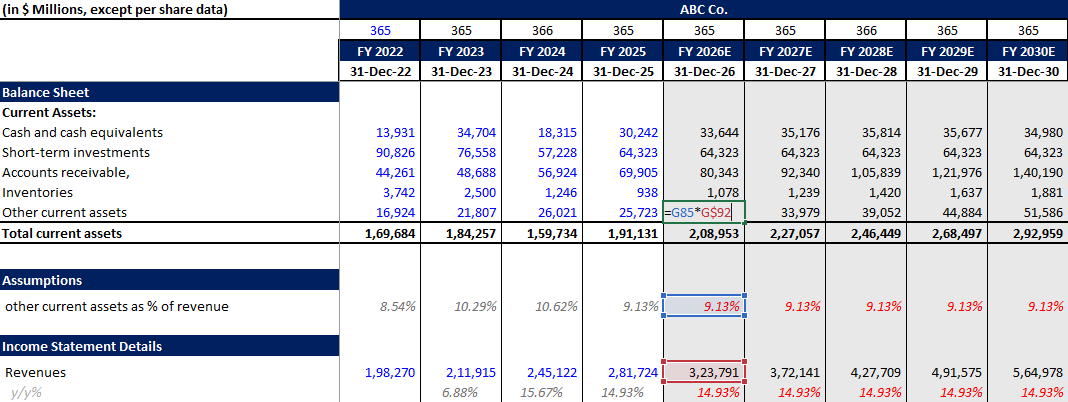
How to Forecast Other Current Assets
While some analysts carry the previous period’s number forward, we forecast other current assets as a percent of revenue. Whatever the percentage was in 2025, that remains the same from 2026 to 2030. For example, in case Microsoft company other current assets as % of revenue was 9.13% in 2025 so we assumed the same until 2030 for our financial model.
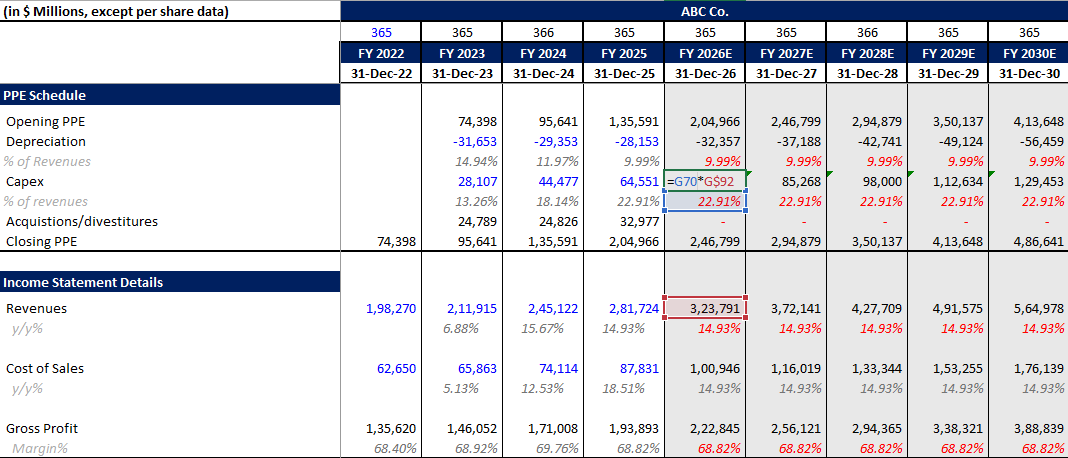
How to Forecast PPE (CapEx and Depreciation)
To forecast Property, Plant, and Equipment (PPE), you need to build a PPE schedule. The basic roll-forward formula is:
$$Closing\ PPE = Opening\ PPE – Depreciation + CapEx \pm Acquisitions/Divestitures$$
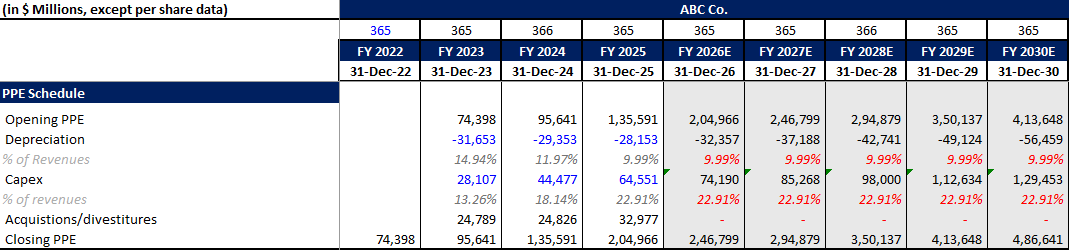
Forecasting the variables:
Depreciation: Forecasted as a percent of revenue. In our Microsoft case study, let’s say depreciation as %of revenues was 9.99% in 2025 so we have kept the percent same until 2030. Then, we have multiplied it with revenues to calculate depreciation of forecasted periods.

CapEx: Forecasted as a percent of revenue.Multiply these margins by your forecasted revenues to get the numbers for your schedule. The closing balance directly links to your balance sheet.
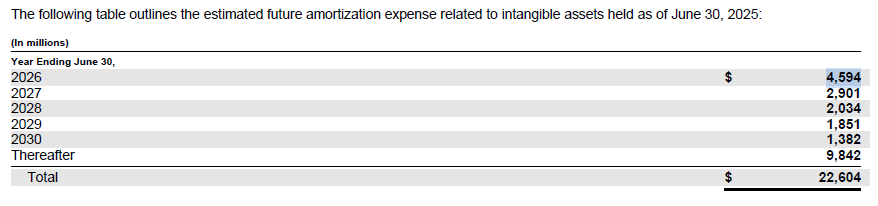
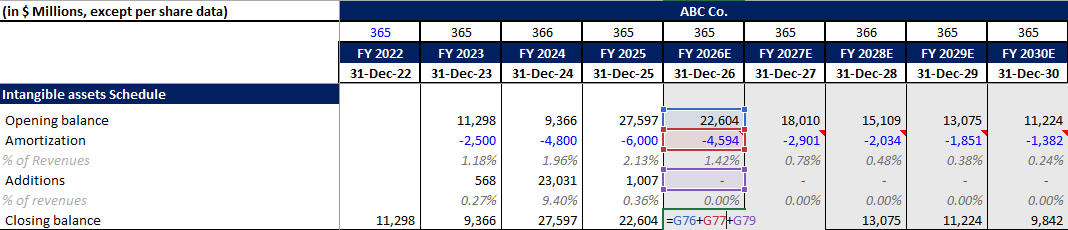
How to Forecast Intangible Assets and Goodwill
Intangible Assets: This works like the PPE schedule, but uses amortization instead of depreciation. Instead of forecasting on a revenue basis, if a company (like Microsoft) provides expected amortization expenses for the next five years in their filings, hardcode those estimates directly into the model. For example, in the below image we have attached a screenshot from 2025 10K of Microsoft to share the expected amortization expense,
Goodwill: Given its nature, goodwill is difficult to forecast. Assume it as a constant factor.
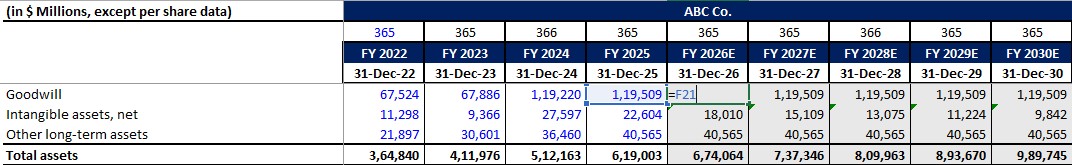
Assumed that in Goodwill was 119,509 in 2025, so we have assumed it will remain same until 2030 to keep the model simple and easy to understand.
Operating Lease Right-of-Use Assets / Other Investments: Assumed as constant unless you have sufficient data to create a schedule.
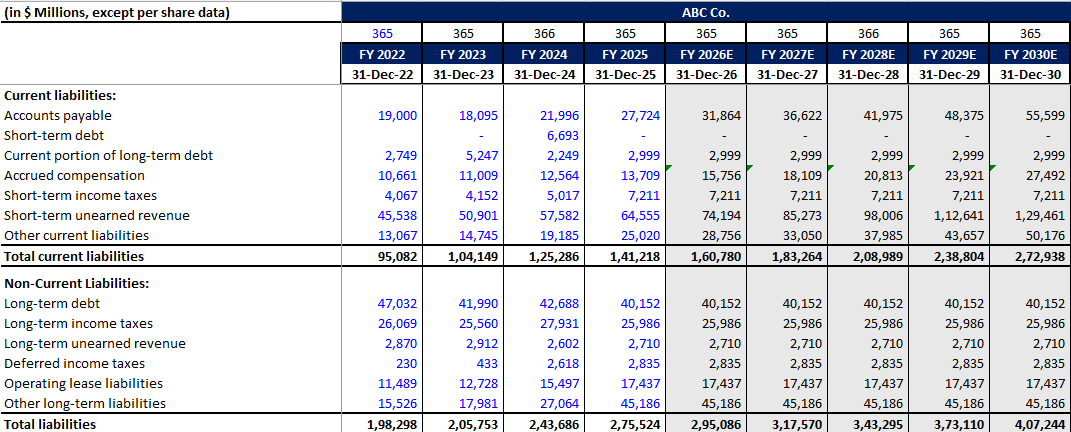
How to Forecast Liabilities and Equity
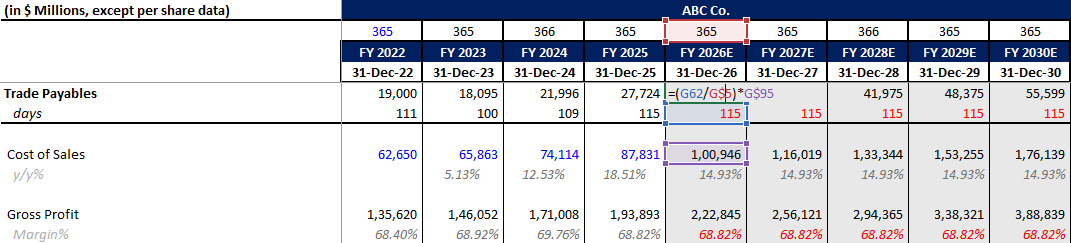
How to Forecast Accounts Payable
Accounts payable is forecasted just like inventory, utilizing COGS. We use Days Payable Outstanding (DPO):
$$DPO = \left( \frac{Accounts\ Payable}{COGS} \right) \times 365$$
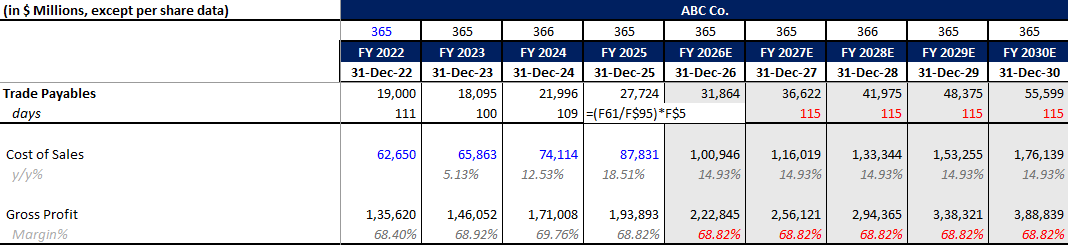
$$Forecasted\ Accounts\ Payable = \left( \frac{COGS}{365} \right) \times DPO$$
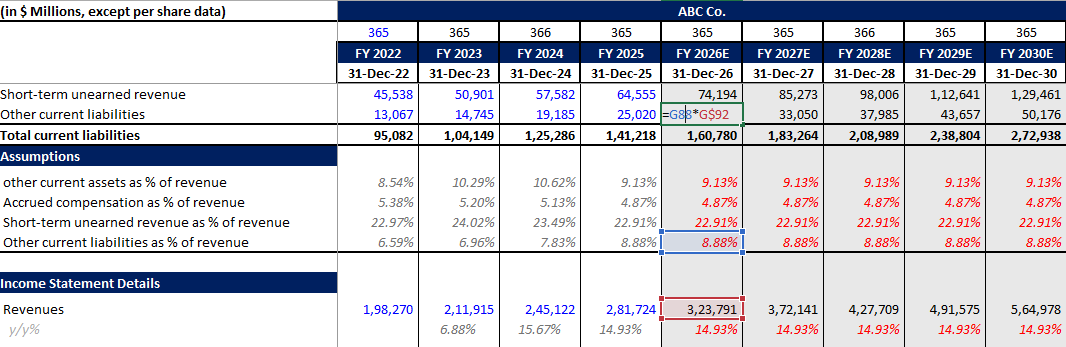
Accrued Compensation & Unearned Revenue
The simplest way to forecast accrued compensation, short-term unearned revenue, and other current liabilities is as a percent of revenue. Calculate the 2025 percentage and hold it constant moving forward.
Accrued Compensation:
You can calculate accrued as percent of revenues. For our case study, it was 4.87% in 2025 so we have assumed the same rate till 2030 to forecast accrued compensation in future periods.
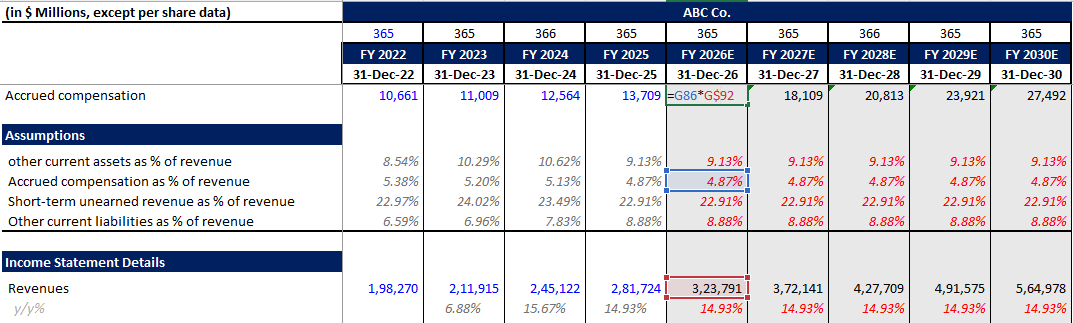
Short-term unearned revenue:
For our case study, it was 22.91% in 2025 keeping it constant until 2030 makes the model simple.
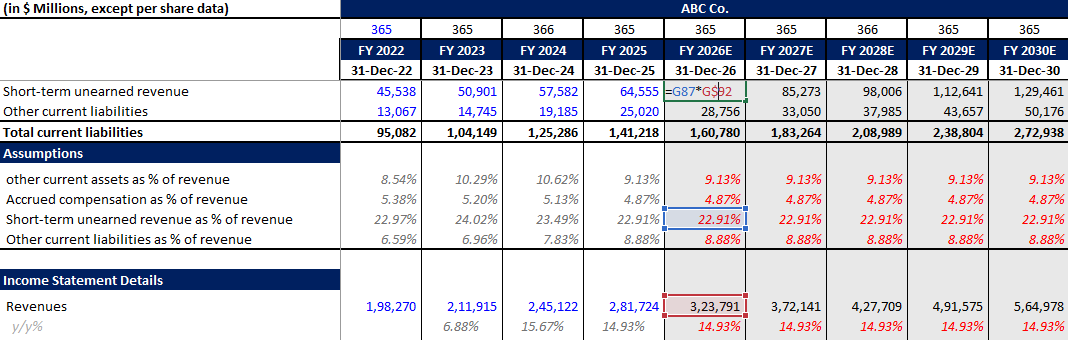
Other Current Liabilities:
In the same like unearned revenues or accrued compensation, we have forecasted other current liabilities.
Long-Term Debt and Taxes
If a company provides a table of future debt prepayments, you can build a debt schedule. Since we are focusing strictly on the balance sheet without a cash flow statement at the moment, we assume the following as constant for simplicity:
- Short-term debt
- Current portion of long-term debt
- Long-term debt
- Long-term income taxes
- Long-term unearned revenue & deferred income tax
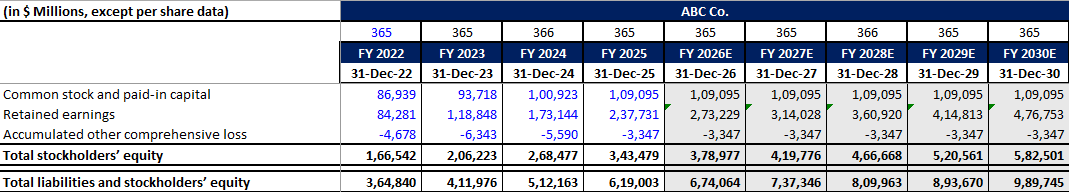
Stockholders’ Equity
Common Stock: Usually considered constant.
Paid in Capital: It includes adjustment of issuance or repurchase of shares that we can get from cash flows. In our case study, we haven’t forecasted cash flow so we have decided to keep these line items as constant until 2030.

Retained Earnings: Properly, retained earnings should be adjusted for net income and dividend payments. However, without cash flow data in this specific exercise, it can be forecasted as a percent of revenue.
Comprehensive Loss: Assumed as constant.
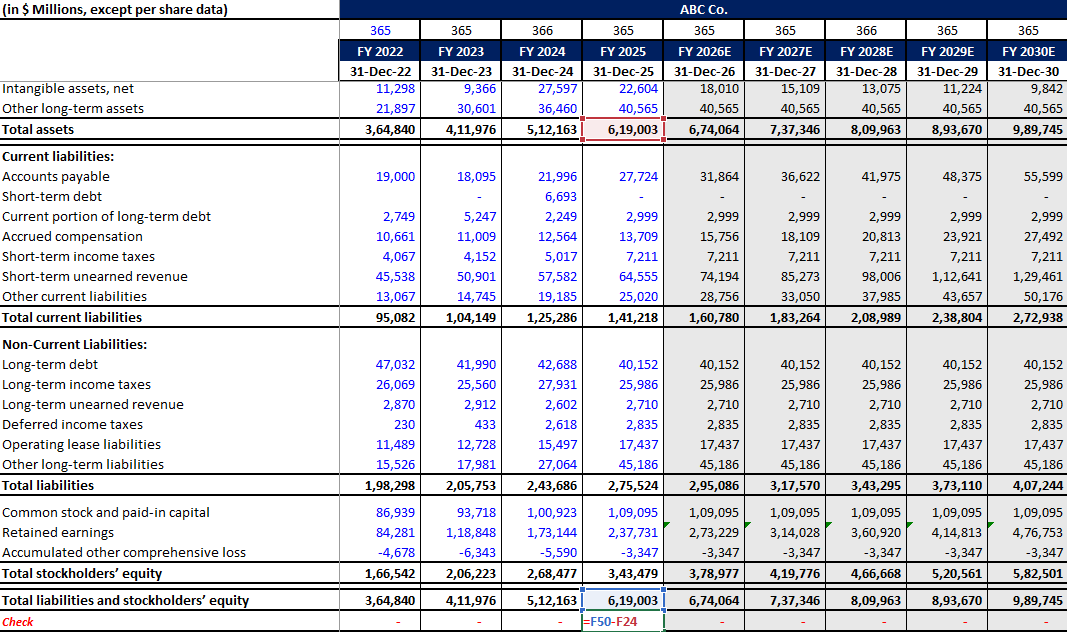
The Balancing Figure: Cash and Cash Equivalents
Cash and cash equivalents are usually linked to the cash flow ending balance. Because we are building this without the cash flow statement at the moment, we make cash the balancing figure (the “plug”) of the financial model to ensure Assets equal Liabilities plus Equity:
$$Cash = (Total\ Liabilities + Total\ Equity) – Non\text{-}Cash\ Assets$$
Balance Sheet Sanity Checks
Always include an automated “sanity check” row at the very bottom of your balance sheet. This is a simple formula that subtracts Total Liabilities and Equity from Total Assets (=Total Assets - (Total Liabilities + Total Equity)). If your model is built correctly, this cell must evaluate to 0 (or display TRUE).
If your sanity check is showing a non-zero number, your balance sheet is officially “out of balance.” Here are the three most common reasons for the mismatch:
Broken Cell References (Wrong Linking): Financial models are highly interconnected. If your balance sheet fails to balance, you likely linked a formula to the wrong cell or hardcoded a number that should be dynamic. For instance, ensure your Net Income is correctly flowing from the Income Statement into your Retained Earnings schedule. Always use Excel’s “Trace Precedents” tool to verify your links.
Sign Convention Errors: This is the most common mistake in financial modeling. You may have accidentally added a line item when you were supposed to subtract it. For example, Capital Expenditures (CapEx) should decrease your cash, and Depreciation should reduce your PPE. If your positive and negative signs are flipped anywhere in your schedules, your balance sheet will instantly break.
Missing the “Double-Entry” Effect: Accounting operates on the double-entry system, meaning every transaction must have two equal and opposite effects. If you add a new asset but forget to increase a corresponding liability (or decrease cash), your model will fail. Furthermore, if you are building a fully integrated 3-statement model, ensure your “Cash and Cash Equivalents” line item is perfectly linked to the ending balance on your Cash Flow Statement.
This way, you can forecast your entire balance sheet and structure it practically. You can use the sample template below to edit your numbers and check out all the prepared schedules.
The tutorials, resources, financial models, and Excel templates provided by Finance With Logic are strictly for educational and informational purposes. They do not constitute professional financial, legal, tax, or investment advice. Financial forecasting involves inherent risks and assumptions. Please consult with a certified financial advisor, CPA, or registered broker before making any real-world investment decisions, executing trades, or finalizing corporate capital allocations based on these materials. Use of these models is at your own risk.
FAQ
To forecast a balance sheet in Excel, you will need to add historical data first for atleast 2 years and then need to forecast important line items like cash, accounts receivables, inventories, PPE, other current and non-current assets, accounts payables, accrued expenses, debt (short + long term), and equity. Also, add a check to ensure you balance sheet matches properly.
Accounts payable is forecasted just like inventory, utilizing COGS. We use Days Payable Outstanding (DPO):
$$DPO = \left( \frac{Accounts\ Payable}{COGS} \right) \times 365$$
$$Forecasted\ Accounts\ Payable = \left( \frac{COGS}{365} \right) \times DPO$$
Accounts receivable is calculated using the Days Sales Outstanding (DSO) number.
$$DSO = \left( \frac{Accounts\ Receivable}{Revenue} \right) \times 365$$
$$Forecasted\ Accounts\ Receivable = \left( \frac{Revenue}{365} \right) \times DSO$$
If a company provides a table of future debt prepayments, you can build a debt schedule.
Inventory is forecasted similarly to accounts receivable, but prices are calculated on cost of sales (COGS) rather than revenue. We use Days Inventory Outstanding (DIO):
$$DIO = \left( \frac{Inventory}{COGS} \right) \times 365$$
$$Forecasted\ Inventory = \left( \frac{COGS}{365} \right) \times DIO$$


Leave a Reply