
Revenue forecasting is probably the most critical and one of the most important things that you would ever have to do if you are working in the financial industry. Whether you are an equity research analyst, a corporate finance professional, or a startup founder, the “Top Line” is where everything begins. If you don’t get the revenue right, your whole financial model will be wrong.
Revenue forecasting is often considered the trickiest part of financial modeling. It isn’t just about formulas in a spreadsheet; it requires a mix of looking at historical data, having a good “gut feeling” or intuition about the market, and really understanding what actually drives the business. Every founder, investor, and stakeholder looks at the revenue forecast first because it tells them if the business has potential or if it is going nowhere.
In this deep-dive guide, we will break down exactly how revenue forecasting works in the real world, why it is the heartbeat of finance, and look at the actual methods used to analyze big public companies in the USA.
What is Revenue Forecasting in Simple Terms?
In very simple terms, revenue forecasting is just the process of estimating how much money (income) a business will make in the future. But for a finance professional, it’s much more than just a guess. It is the bridge between what a company can do today and what it wants to achieve tomorrow.
Let’s look at a real-life example to make it clear. Imagine you are looking at a company in 2024, and they made $100 million in revenue. Then in 2025, that number goes up to $120 million. Now, as an analyst, your job is to estimate what will happen in 2026.
That number you come up with for 2026 isn’t just a “hopeful” number. It is a projection based on your ideology, your skills, and your assumptions about the economy. You are basically taking a business “hunch” and turning it into a hard number. Whether you call it net sales, turnover, or top-line income, forecasting is how you define the growth path of a business.
Why Revenue Forecasting Matters: Who is Looking?
Why do we spend so many hours trying to get this one number perfect? Because everyone in the financial world uses this forecast as their main compass.
1. The Investor’s Perspective
Investors are always looking for one thing: growth. If a company’s revenue forecast looks flat or is going down, the value of the company drops and investors will take their money elsewhere. They look at the revenue first because it proves that people actually want to buy the product. If sales aren’t growing, the business isn’t scaling. No smart investor will put money into a company that can’t show a clear plan to increase sales.
2. The Analyst’s Perspective
For people building big financial models (like a DCF or a 3-statement model), revenue is the “independent variable.” This means almost every other line on the sheet—like the cost of materials, marketing spend, and even taxes—is usually calculated as a percentage of revenue. If your revenue forecast is off by just 5%, your final valuation of the company could be off by 10% or more. This is why analysts spend so much time getting the “Top Line” right.
3. The Internal Business Perspective
From a founder or manager’s point of view, forecasting is about survival.
Inventory Management: If you forecast a 30% jump in sales but don’t buy enough stock, you’ll run out and lose customers.
Hiring: Forecasting tells you if you have enough money coming in to hire 50 new people or if you need to wait.
Cash Flow: It tells the CFO exactly when the company might run out of cash and when they will have extra money to reinvest in new projects.
The 4 Main Approaches to Forecasting
When you sit down with your Excel sheet, you need to decide which “logic” you are going to use. In the industry, we usually pick from these four:
1. The Top-Down Approach
This starts with the “Big Picture.” You look at the Total Addressable Market (TAM) and then decide what tiny slice of that pie your company can grab.
The Logic: “The global market for bottled water is $300 billion. If our new brand can just get 0.1% of that, we will make $300 million.”
Pros: Good for new industries where you don’t have old data.
Cons: Often way too optimistic. It ignores whether the company is actually capable of reaching that many people.
2. The Bottom-Up Approach (The Professional Favorite)
This is widely considered the most realistic method. Instead of starting with the whole world, you start with what the company actually does to make money.
The Logic: You break revenue into “Atomic Units.” For an e-commerce site, you look at: Website Traffic × Conversion Rate × Average Order Value.
Pros: Very accurate and allows you to test different scenarios (like “What if our traffic drops?”).
3. The Historical Growth Method
If a business is old and stable, you can use the past to predict the future. This is the “Year-over-Year” (YoY) method.
The Logic: If a company has grown at 8% for the last five years, you assume it will grow by 8% again next year.
Formula:$$\text{Forecasted Revenue} = \text{Revenue last year} \times (1 + \text{Growth Rate %})$$
4. Driver-Based Forecasting
This is an advanced version of the bottom-up approach. It looks at the specific “Levers” that management can pull to change the business.
Retail: The driver is “New Store Openings.”
SaaS: The driver is “Monthly Active Users.”
Key Drivers to track: Price per unit, Volume, Store Count, and Churn Rate.
Real-Life Methods for Your Financial Model
Now let’s look at the actual math you will use in your Excel templates. These are the formulas professionals use when looking at US public companies like Apple, Walmart, or Netflix.
Method A: The Volume × Price Model
This is the most basic formula in finance. It works for everything from manufacturing to selling apps.
The Math:$$\text{Total Revenue} = \text{Units Sold} \times \text{Average Selling Price (ASP)}$$
In Excel: You should have two rows—one for Volume growth and one for Price growth. This is much better than just using one total growth percentage because it shows why revenue is going up.
Method B: The SaaS/Subscription Model (ARPU)
For companies like Netflix or Spotify, revenue comes from people paying every month.
The Math:$$\text{Total Revenue} = \text{Total Subscribers} \times \text{Average Revenue Per User (ARPU)}$$
The Pro Tip: To be really accurate, you must track “Churn” (people leaving) and “New Sign-ups” separately to get the final subscriber count.
Method C: The Retail “Like-for-Like” (LFL) Model
Retailers like Walmart or Target use a method called Same-Store Sales.
Why it matters: If a company’s revenue is growing because they are opening 100 new stores, but their old stores are losing money, the business is actually in trouble.
The Formula:$$\text{Total Revenue} = (\text{Old Stores} \times \text{LFL Growth %}) + (\text{New Stores} \times \text{Sales per New Store})$$
Real-World Cases: How to Forecast 4 Different US Companies
Now, let’s look at some real-world scenarios. We have picked four major US public companies to show you how to forecast revenues based on the key drivers they report in their 10-K (Annual) and 10-Q (Quarterly) filings.
In these examples, we will look at the 2024 and 2025 actual numbers to forecast the next three years: 2026, 2027, and 2028.
1. Apple (AAPL): The Segment YoY Growth Approach
Apple is the biggest tech company that reports revenue across several segments: iPhone, Mac, iPad, Wearables (Home & Accessories), and Services.
Years ago, Apple used to report exactly how many iPhones they sold (Unit Sales), but they don’t do that anymore. Since we don’t have the “Volume” data, we use a simple YoY (Year-over-Year) Revenue Approach.
You can use our YoY Calculator to calculate the revenues growth rate for any business.
The Method: We calculate the YoY growth rate for each segment from 2024 to 2025.
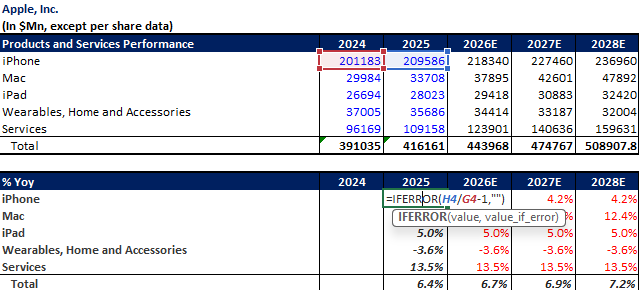
The Forecast: We then apply that same growth rate to the 2026–2028 periods.
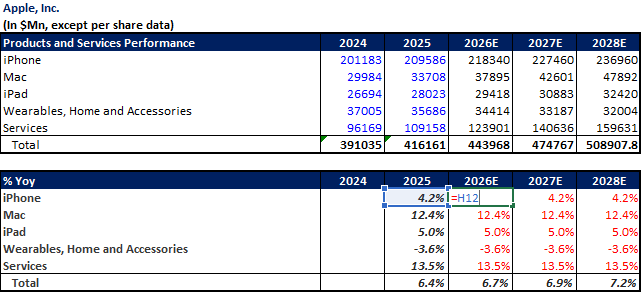
Excel Tip: Once you have the growth rate, you “back-calculate” the absolute revenue for each segment. For example, if iPhone revenue was $200B and you assume 5% growth, your 2026 forecast is $210B.
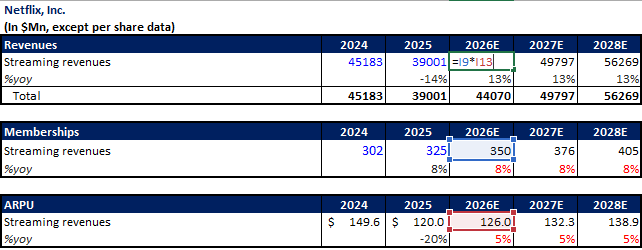
2. Netflix (NFLX): The Subscription & ARPU Model
Netflix is the perfect example of a subscription business. To forecast their revenue, we look at two main drivers: Streaming Memberships and Streaming Revenue.
The Method: We calculate the ARPU (Average Revenue Per User) by dividing the total revenue by the number of memberships.
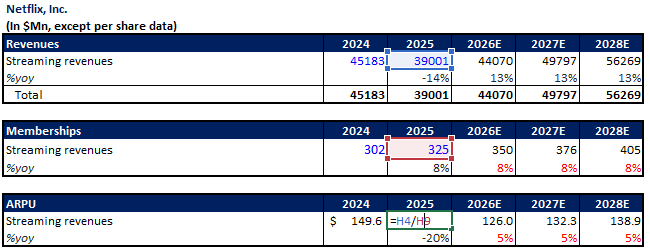
The Forecast: Let’s say their membership grew by 8% in 2025. We can assume that 8% growth stays steady through 2028. For the ARPU, if it dropped recently but we expect it to stabilize, we might assume a 5% growth rate for 2026–2028.
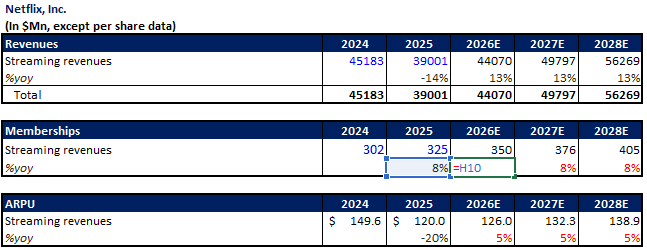
The Result: Multiply your forecasted Memberships by your forecasted ARPU to get the total Streaming Revenue.
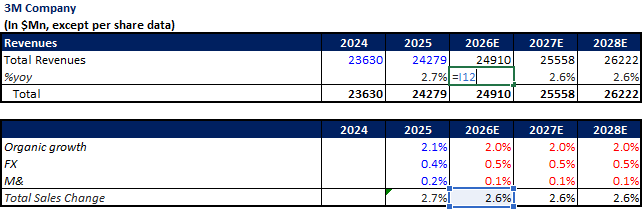
3. 3M Company (MMM): The Organic & M&A Approach
3M is a giant industrial company that reports revenue growth in a very specific way. They break it down into Organic Growth, FX (Foreign Exchange) Impact, and M&A (Mergers & Acquisitions).
The Method: Instead of one big number, we forecast the three pieces that make up the total change.
- Organic Growth: Sales from their existing business (Price/Volume).
- FX Impact: How much the value of the dollar affects their global sales.
- M&A: Revenue added from buying other companies.
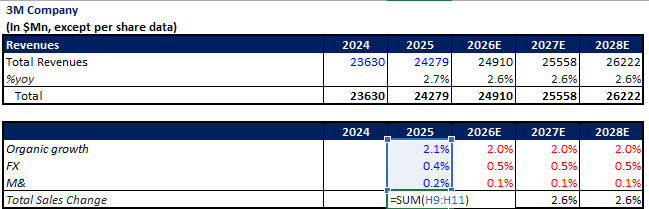
The Forecast: For 2026–2028, we might assume:
- Organic Growth: 2.0%
- FX Impact: 0.5%
- M&A Impact: 0.1%
- Total Sales Change: By summing these up, we get a total YoY change of 2.6%, which we then use to project the total revenue.
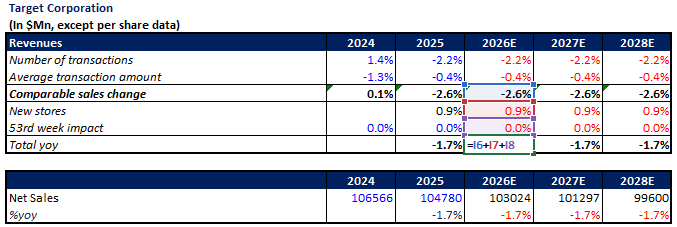
4. Target (TGT): The Retail & Comparable Sales Model
For a retail giant like Target, the most important number is Comparable Sales Change (also called “Same-Store Sales”).
The Method: Comparable sales are driven by two things: the Number of Transactions and the Average Transaction Amount (how much people spend per visit).
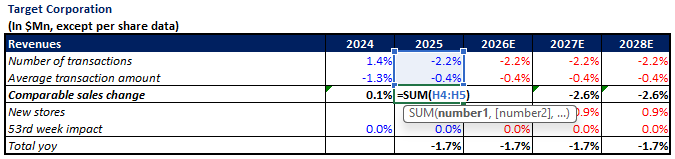
The Forecast: We first forecast the Comparable Sales. If 2025 was a tough year (e.g., -2.6% growth), we decide if that trend will continue or improve.
The Total Growth Formula: To get the final “Net Sales” forecast, we add three things together:$$\text{Total YoY Change} = \text{Comp Sales \%} + \text{New Store Impact \%} + \text{53rd Week Impact \%}$$(Note: The 53rd week is an extra week of sales that happens every few years in retail. For 2026–2028, we usually assume 0% unless we know it’s a 53-week year.)
Summary of Forecasting Methods
| Company | Main Approach | Key Drivers |
| Apple | Segment YoY | Revenue per Product Line |
| Netflix | Subscription Model | Memberships & ARPU |
| 3M | Components of Growth | Organic, FX, and M&A |
| Target | Retail / LFL | Transactions, Ticket Size, & New Stores |
By looking at these four different industries, you can see that there isn’t just one way to forecast. You have to look at the key drivers the company reports in their 10-K/10-Q/PR to build a model that actually makes sense.
Download the free template here and try to forecast revenues for your industry.
Common Mistakes to Avoid (Read This Carefully!)
Even the pros make mistakes that ruin their models. Here are the three biggest ones:
Blindly Following the Past: Never just drag a 10% growth line forever. As companies get bigger, it gets harder to grow. Also, watch out for “weird” years like 2020 (the pandemic). If you use pandemic growth rates for 2026, your forecast will be totally wrong.
Ignoring Seasonality: If you are forecasting for a toy store or a clothing brand, December is going to be massive. If you assume every month is the same, your cash flow forecast will fail. You must include the “Seasonality Impact” in your numbers.
The “Infinite Expansion” Trap: Don’t assume a company can open 500 stores every year forever. Eventually, they run out of space or customers. Always check if your “Bottom-Up” plan actually fits into the “Top-Down” reality of the market.
Conclusion: Putting it All Together
Revenue forecasting is the ultimate test for anyone in finance. It requires you to look beyond just the numbers and understand the “story” of the company. By using a mix of Top-Down and Bottom-Up methods, you can create a forecast that isn’t just a guess, but a real roadmap.
Don’t forget to check out our Free Revenue Forecasting Excel Template. We’ve included real-world examples from US public company filings to help you see exactly how the pros do it. Use these templates to practice and start building your own models today!
The tutorials, resources, financial models, and Excel templates provided by Finance With Logic are strictly for educational and informational purposes. They do not constitute professional financial, legal, tax, or investment advice. Financial forecasting involves inherent risks and assumptions. Please consult with a certified financial advisor, CPA, or registered broker before making any real-world investment decisions, executing trades, or finalizing corporate capital allocations based on these materials. Use of these models is at your own risk.
Revenue forecasting is just the process of estimating how much money (income) a business will make in the future. But for a finance professional, it’s much more than just a guess. It is the bridge between what a company can do today and what it wants to achieve tomorrow.
There are several ways through which you can forecast revenues. You can forecast by,
Method A: The Volume × Price Model
Method B: The SaaS/Subscription Model (ARPU)
Method C: The Retail “Like-for-Like” (LFL) Model
Method D: YoY Growth Rate
It totally depends on industry you are looking at. You need to look at drivers and forecast using those drivers.
For investors – They look at the revenue first because it proves that people actually want to buy the product.
From a founder or manager’s point of view, forecasting is about survival.
Inventory Management: If you forecast a 30% jump in sales but don’t buy enough stock, you’ll run out and lose customers.
Hiring: Forecasting tells you if you have enough money coming in to hire 50 new people or if you need to wait.
Cash Flow: It tells the CFO exactly when the company might run out of cash and when they will have extra money to reinvest in new projects.
The simplest way of revenue forecasting is using yoy growth. You just need to calculate yoy growth and using that growth you can back calculate the revenues for future periods.


Leave a Reply