
Inventory forecasting is one of the most critical paths for any business, sitting right at the intersection of operations and finance. If you are a financial professional or an aspiring analyst, you know that forecasting inventory is a daily task. It isn’t just a line item on a spreadsheet; it is a significant factor that dictates how a business operates, how it manages its cash, and how it handles different seasons of demand.
Forecasting inventory helps us understand the current business scenario and predicts how the company will operate in the future. In this guide, we will break down the process of inventory forecasting, why it matters for your financial model, and the exact formulas you need to get it right.
What is Inventory Forecasting?
At its core, Inventory Forecasting is the process of estimating the amount of stock a business needs to hold in the future. This estimate is based on expected customer demand, sales trends, and operational factors.
A good forecast answers three vital questions:
- How much stock do we need? To ensure we can meet future sales and keep customers happy.
- When should we reorder? To avoid running out of stock (stockouts) while ensuring inventory doesn’t sit idle for too long.
- How will this affect our cash? Because every dollar tied up in a warehouse is a dollar that isn’t in the bank.
The Financial Perspective: Inventory as Working Capital
In financial modeling, we treat inventory as a key component of Working Capital. It has a direct “domino effect” on the three financial statements:
- Balance Sheet: It sits under Current Assets.
- Cash Flow Statement: Changes in inventory levels represent cash inflows or outflows.
- Income Statement: It is linked directly to the Cost of Goods Sold (COGS).
Before we forecast the inventory itself, we must first build the foundation by forecasting Revenue and COGS.
Step 1: Forecasting Revenue and Gross Profit
To get to an accurate inventory number, we start with the Profit and Loss (P&L) account. We generally look at historical data (e.g., 2022–2025) to set our assumptions for the future.
Revenue Forecasting (YoY Approach)
We calculate the Year-over-Year (YoY) Growth to see how fast the business is expanding. You can use our “YoY Calculator” also.
The Formula:
$$\text{Revenue Growth %} = \left( \frac{\text{Current Year Revenue}}{\text{Previous Year Revenue}} \right) – 1$$
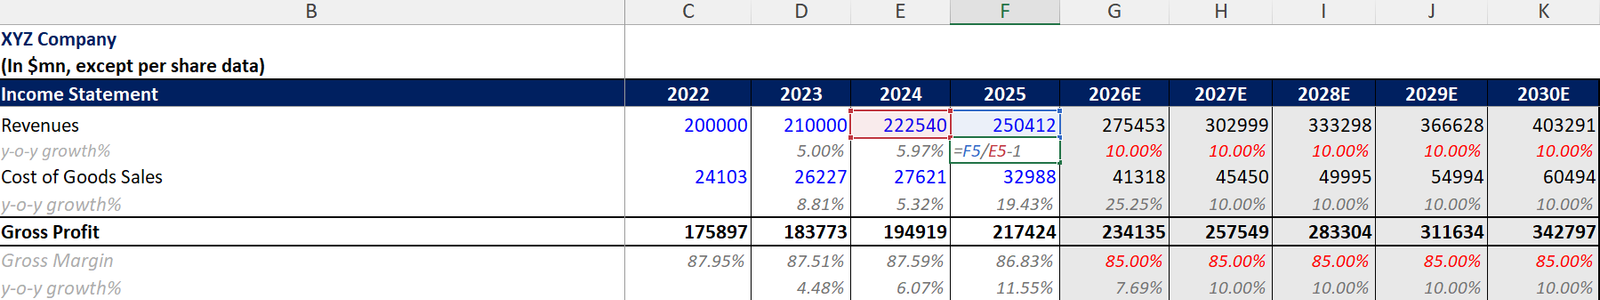
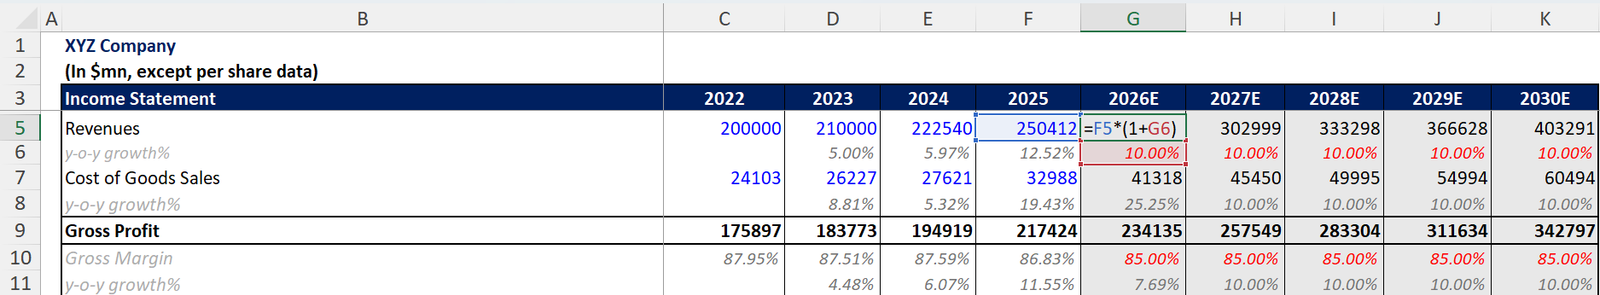
If your historical data shows steady growth, you might assume a fixed rate (like 10%) for your forecast period (2026–2030). You then “calculate forward” to get your future revenue numbers. You can check out our detailed guide on “How to forecast revenues“.
Gross Profit and COGS
Instead of guessing the cost of goods directly, it is often more accurate to forecast the Gross Margin.
The Formula:
$$\text{Gross Margin %} = \frac{\text{Gross Profit}}{\text{Revenue}}$$
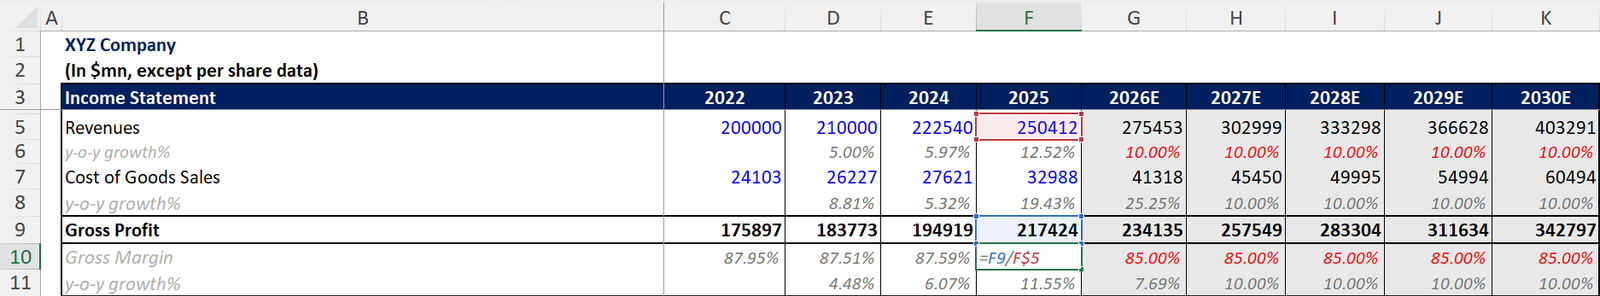
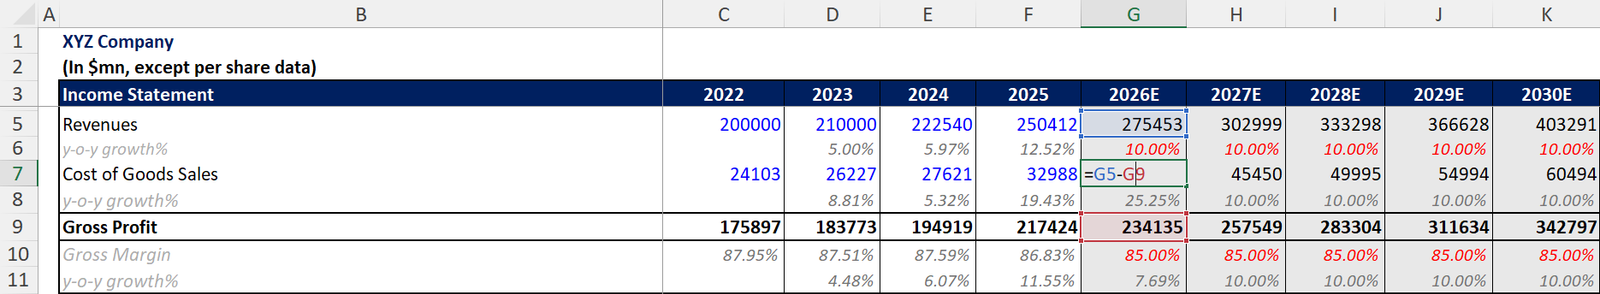
If your historical margin is between 80% and 88%, you can use an average (e.g., 85%) for your future years. Once you have the Gross Margin and Revenue, you can find your Cost of Goods Sold (COGS):
- Gross Profit = $$\text{Revenue} \times \text{Gross Margin %}$$
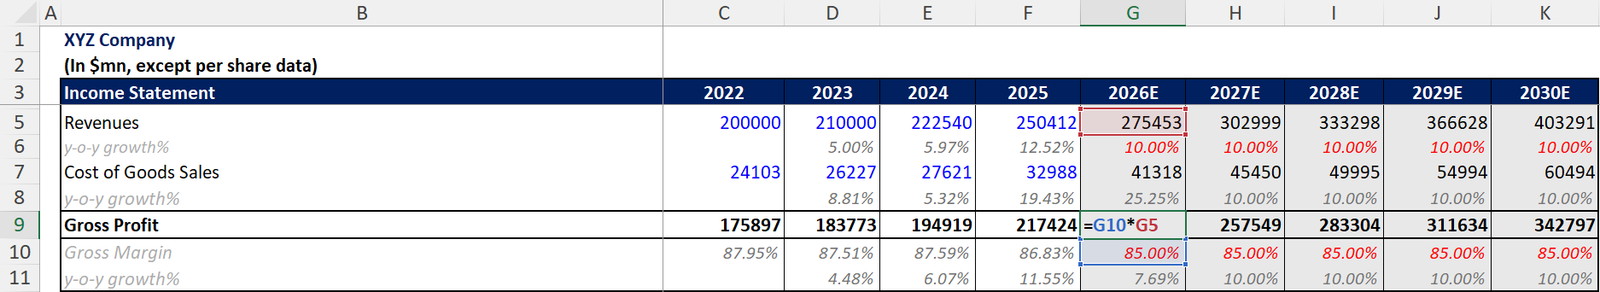
- COGS = $$\text{Revenue} – \text{Gross Profit}$$
Step 2: The Inventory Schedule (Using DIO)
Now that we have our forecasted COGS, we can build the inventory schedule. The most common way to forecast inventory in a financial model is by using Days Inventory Outstanding (DIO).
What is DIO?
DIO tells us how many days, on average, a company holds its inventory before selling it.
The Formula (Historical):
$$\text{DIO} = \left( \frac{\text{Inventory}}{\text{COGS}} \right) \times 365$$
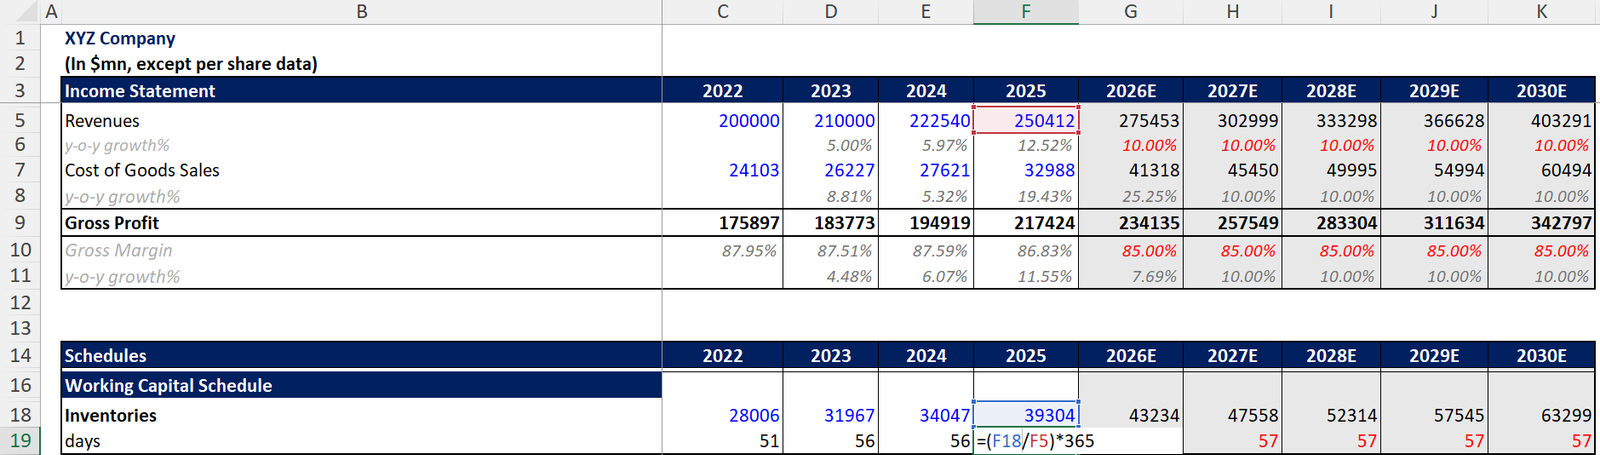
(Note: Use 365 for yearly models, 90 for quarterly, and 30 for monthly.)
Forecasting the Future Inventory
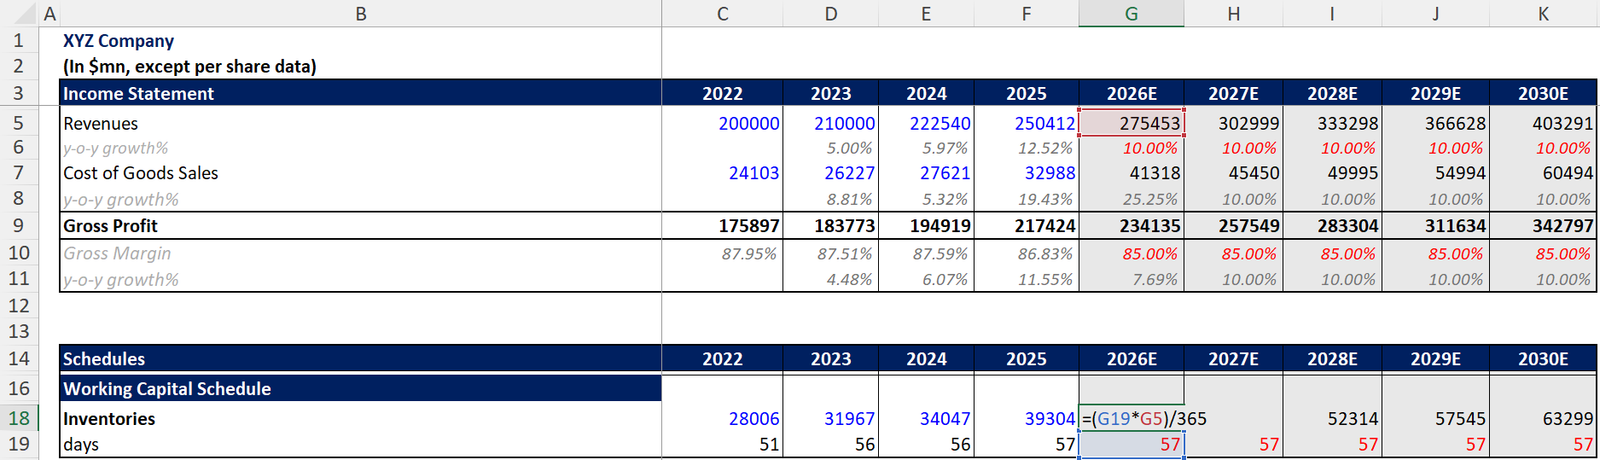
If your 2025 DIO was 57 days, you can assume the company maintains this efficiency from 2026 to 2030. To find the actual Inventory Value for your forecast, you flip the formula:
The Forecast Formula:
$$\text{Forecasted Inventory} = \frac{\text{DIO} \times \text{COGS}}{365}$$
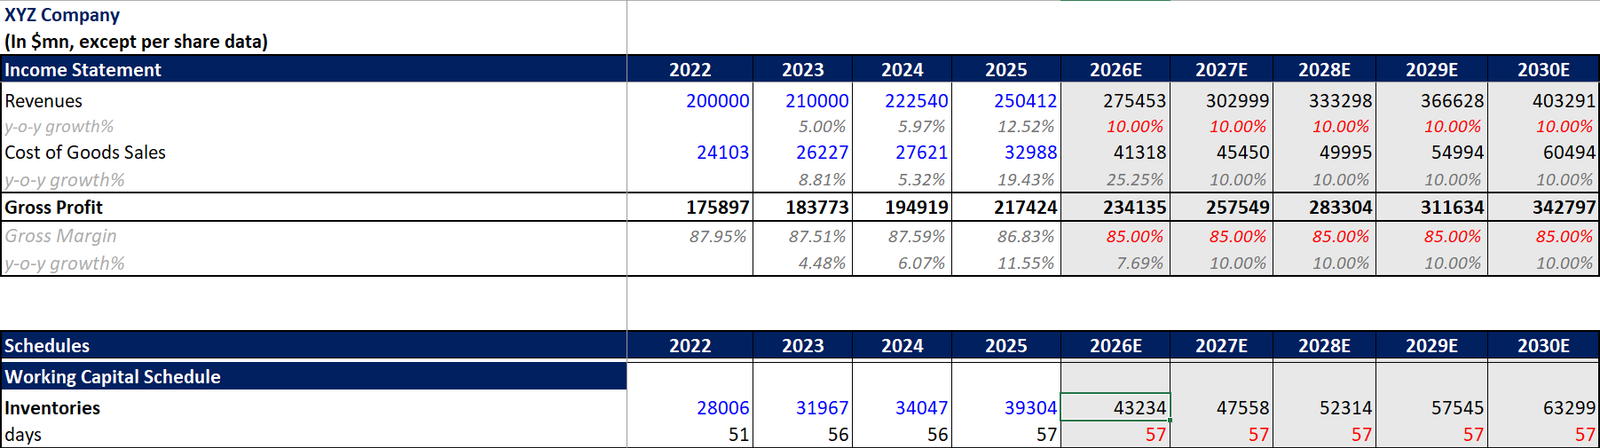
By keeping the DIO constant, your inventory grows in proportion to your sales. You can also perform a “Sensitivity Analysis” by changing the DIO (e.g., what if it takes 60 days to sell?) to see how it impacts your cash.
Step 3: Integrating with the Three-Statement Model
Once you have your forecasted inventory numbers, you must link them correctly to ensure your model balances.
1. The Balance Sheet
The forecasted inventory number for each year is linked directly to the Current Assets section. This shows the value of the goods the company expects to have on hand at the end of the year.
2. The Cash Flow Statement
This is where the impact of inventory is most visible. We look at the Change in Working Capital:
- Increase in Inventory: If inventory goes up compared to the previous year, it is a Cash Outflow (you spent money to buy stock).
- Decrease in Inventory: If inventory goes down, it is a Cash Inflow (you sold stock and turned it into cash).
This step is vital for DCF (Discounted Cash Flow) Valuations. If your inventory forecast is wrong, your Free Cash Flow (FCF) will be incorrect, making your entire company valuation unreliable.
Why This Matters to Finance Professionals
Inventory forecasting isn’t just for warehouse managers. It is a core skill for:
- Equity Research Analysts: To see if a company is becoming inefficient (stockpiling goods they can’t sell).
- Investment Bankers: To understand the liquidity and health of a business during a merger or acquisition.
- FP&A Professionals: To manage the company’s internal budget and ensure there is enough cash to fund operations.
When you manage inventory correctly in a model, you show that you understand the Business Logic. You aren’t just plugging in numbers; you are showing how the company handles its growth and its customers.
Download Our Free Excel Template
To help you practice, we have created a Free Financial Model Template.
- Blue Cells: These are for your hardcoded historical data.
- Red Cells: These are for your assumptions (Revenue growth, Gross Margin, and DIO).
- Black Cells: These contain the formulas we discussed above and will automatically calculate your inventory forecast.
Using this template will allow you to see exactly how an increase in sales affects your inventory levels and your final cash position.
Final Thoughts
Inventory forecasting is much more than a math exercise. It accounts for seasonality, protects the business from demand spikes, and ensures that cash is being used as efficiently as possible. By mastering the relationship between Revenue, COGS, and DIO, you can build financial models that are both accurate and professional.
Whether you are preparing a valuation or managing day-to-day operations, always remember: Inventory is cash. Treat it with the same level of detail as your revenue, and your financial analysis will stand out from the rest.
The tutorials, resources, financial models, and Excel templates provided by Finance With Logic are strictly for educational and informational purposes. They do not constitute professional financial, legal, tax, or investment advice. Financial forecasting involves inherent risks and assumptions. Please consult with a certified financial advisor, CPA, or registered broker before making any real-world investment decisions, executing trades, or finalizing corporate capital allocations based on these materials. Use of these models is at your own risk.
FAQ
You can forecast inventory using DIO which is as follows,
$$\text{Forecasted Inventory} = \frac{\text{DIO} \times \text{COGS}}{365}$$
Inventory Forecasting is the process of estimating the amount of stock a business needs to hold in the future. This estimate is based on expected customer demand, sales trends, and operational factors.
$$\text{DIO} = \left( \frac{\text{Inventory}}{\text{COGS}} \right) \times 365$$
(Note: Use 365 for yearly models, 90 for quarterly, and 30 for monthly.)
In financial modeling, the most reliable method is using Days Inventory Outstanding (DIO). This formula links your stock levels directly to your Cost of Goods Sold (COGS), ensuring that as your sales grow, your inventory levels grow proportionally. The formula is:
$$\text{Forecasted Inventory} = \frac{\text{DIO} \times \text{COGS}}{365}$$


Leave a Reply