
In this article, we will be talking about the 3 statement financial model with a complete guide as well as a free excel template for you to download from our website. The three statement financial model is one of the most critical and one of the most important financial statements building when you are building a financial model for your company or for any other business you are interested in.
Three statement financial models are concerned with learning a step-by-step process on how to create the financial model that basically starts from forecasting and building revenue modelling, then creating the income statement, then doing the balance sheet, and as well as the cash flow statement. However, in this specific guide, we are not talking about the revenue building itself. If you are wanting to know how you can build a revenue model or how you can forecast the revenues, you can read over our “how to forecast revenues” post.
What is a 3 Statement Financial Model?
It is basically concerned with three financial statements: the Income Statement, Balance Sheet, and Cash Flow Statement. These are considered the three most important financial statements in the financial industry. Whether you are governing a company—maybe it’s a public listed company or a private listed company, a startup, or any other thing—if you are working in the financial industry, corporate finance, equity research, or buy-side/sell-side analysis, you have to focus on these three statements.
These three statements are interlinked and tell a lot more about the company and the potential of a company that a business would enjoy in the next two, three, five, or even ten years down the line. As the name says, it is a model which consists of three statements. These provide a very good picture about the business prospects and signals potential. These three statements also help us in carrying out valuations in terms of DCF valuation, relative valuation, or any analysis forecasting. In the absence of these three financial statements, it would not be possible to build a financial model. These three statements only are considered as the blueprint or the structure on the basis of which you can build your financial model. Without them, it’s just redundant, not very useful, or not very accurate or reliable.
The Core Components Explained
We will be talking about each of these components as each of them is very much important and each of them is really very interlinked with each other.
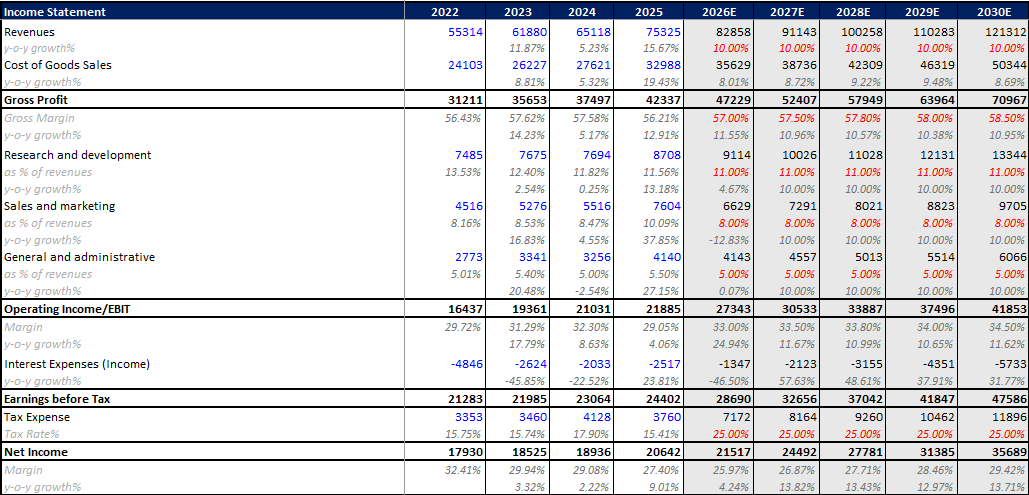
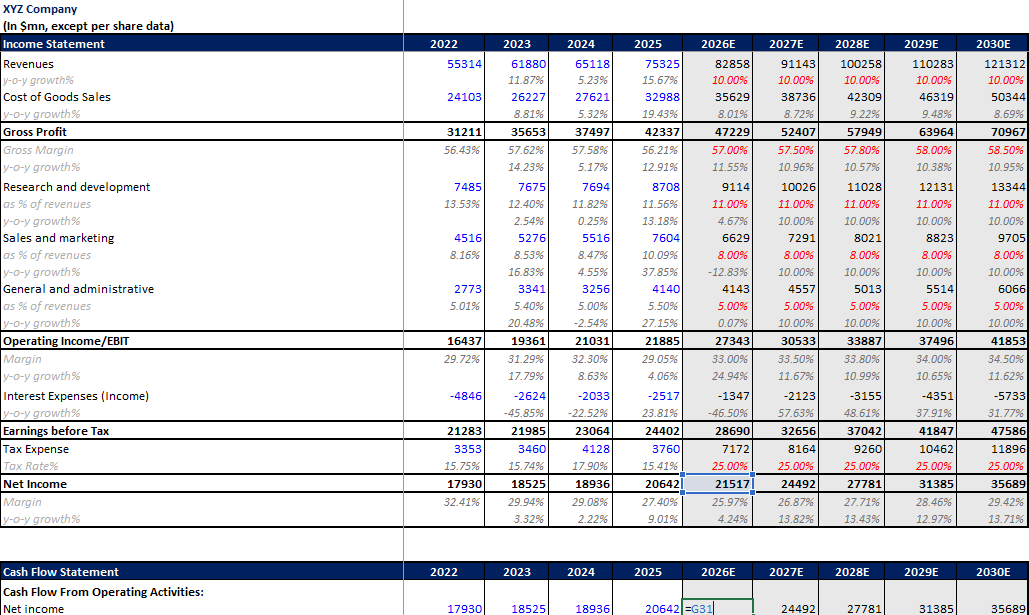
1. The Income Statement
The Income Statement is the first thing that you would have to build while building a three statement financial model. It is basically concerned with the profit and loss of a company in terms of the revenues the company is generating and the expenses the company is incurring.
- Revenues: This is the starting point of the model.
- Cost of Goods Sold (COGS): The direct costs of production.
- Gross Profit: Revenues minus COGS.
- Operating Expenses: Including Research & Development (R&D) and Sales, General & Administrative (SG&A).
- Operating Profit (EBIT): Earnings before interest and taxes.
- Interest Income/Expense: The interest getting earned on cash or paid on debt.
- Earnings Before Tax (EBT): Profit before corporate taxes.
- Taxes: The corporate tax the company has to pay the government.
- Net Income: The final profit after all expenses or adding back all other incomes.
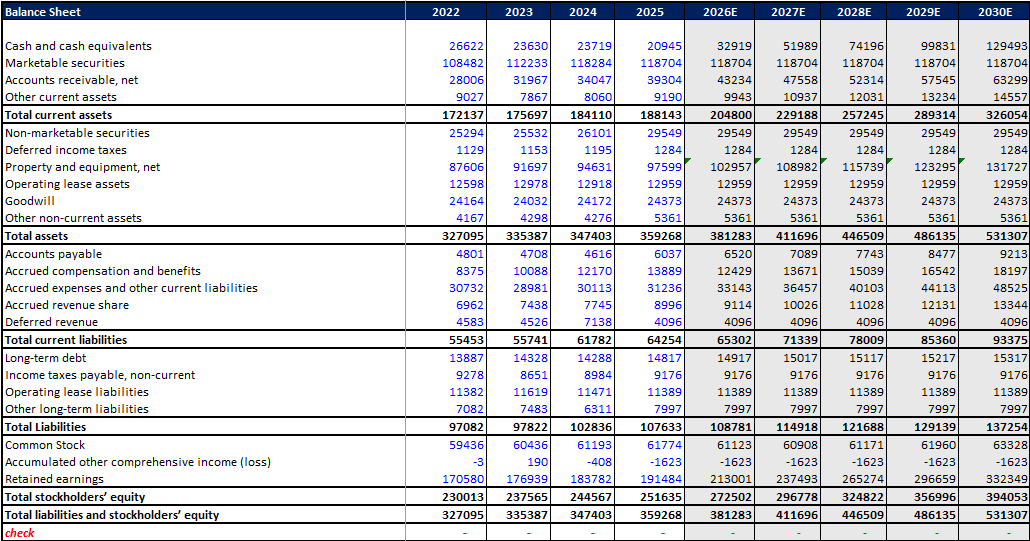
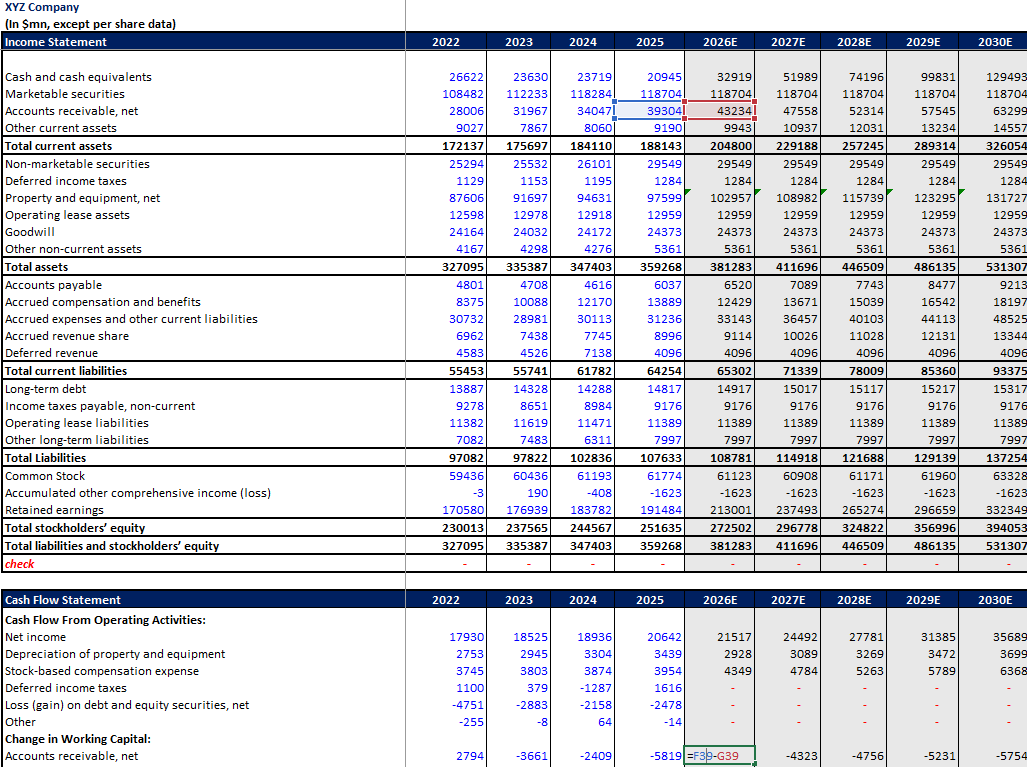
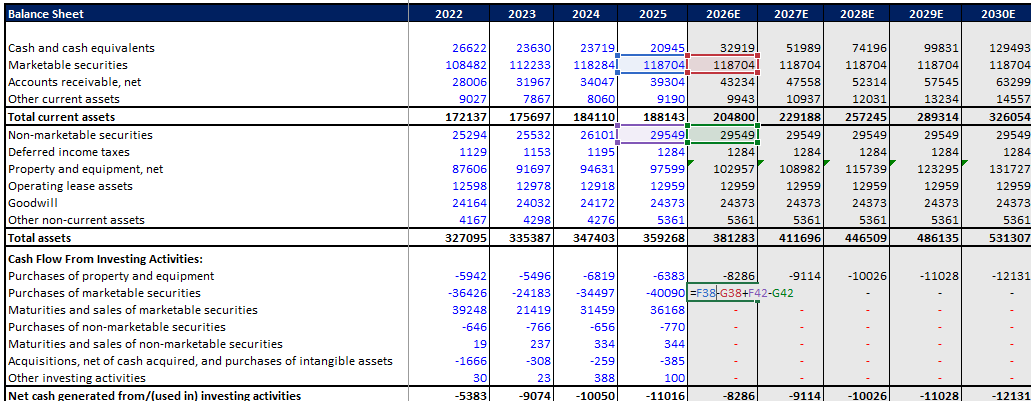
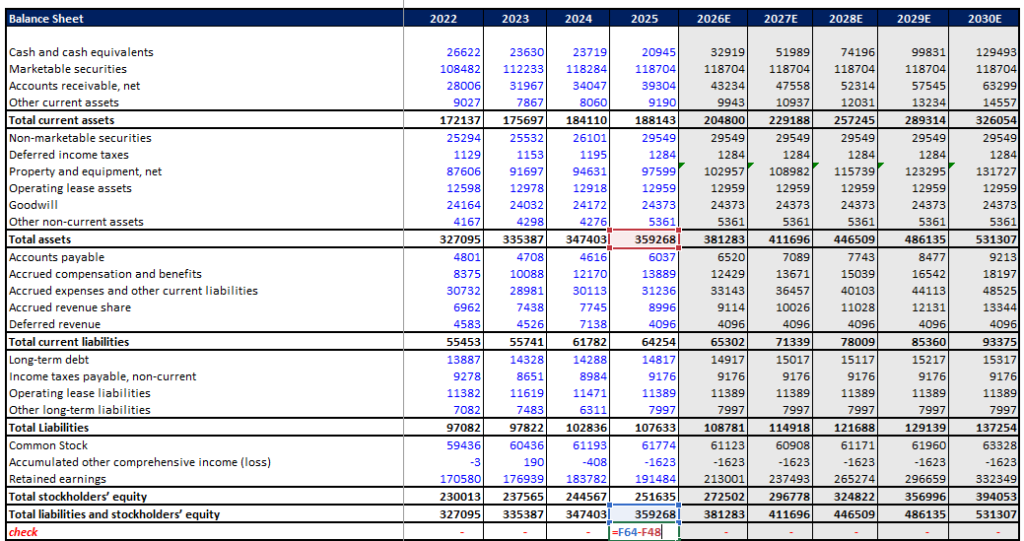
2. The Balance Sheet
The Balance Sheet is considered as the position book of any company, as it tells you where the company stands in terms of assets, liabilities, or capital.
- Current Assets: Short-term assets like cash and cash equivalents, marketable securities, accounts receivables, and inventories.
- Non-Current Assets: Long-term assets like property and equipment (PP&E), lease assets, goodwill, and intangible assets.
- Current Liabilities: Short-term obligations like accounts payable, accrued expenses, and deferred revenue.
- Non-Current Liabilities: Long-term debt, income tax payables, and operating lease liabilities.
- Equity: Includes common stock, retained earnings, or accumulated other comprehensive income.
You can definitely be getting these line items in your 10K or 10Q for any US public listed company or any other listed company across the globe.
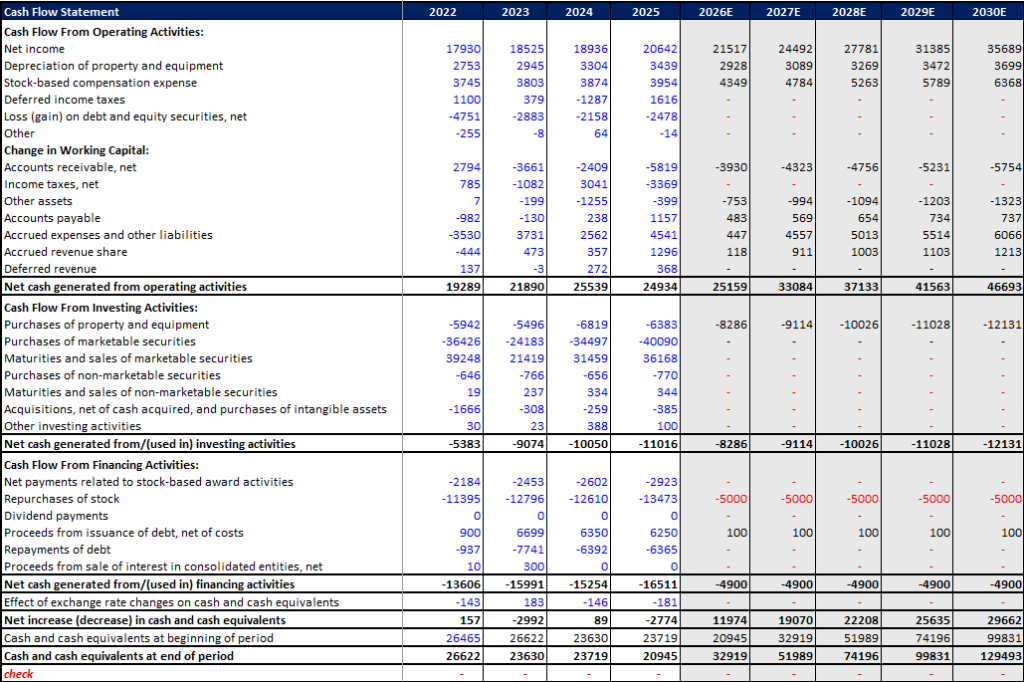
3. The Cash Flow Statement
The Cash Flow Statement consists of:
- Operating Activities: Cash generated from operations, adjusting for non-cash expenses.
- Investing Activities: Cash spent or earned from investments and assets.
- Financing Activities: Cash from debt, stock issuances, or repurchases.
How These 3 Statements are Interlinked
This is the most important part because without linking, there is no sense of building a three statement financial model.
Income Statement to Cash Flow: Net income is the starting point of the cash flow statement.
Balance Sheet to Cash Flow: Whatever change is happening in the balance sheet will directly be reflected in the cash flow statement. Otherwise, there would be a problem of the balance principle of accounting. For example, your current assets, current liabilities, or CapEx must be reflected in the cash flow.
Net Income to Retained Earnings: Net income reflects in the retained earnings of the balance sheet.
Depreciation: This is reflected in the cash flow statement (as an add-back) but also in the income statement to calculate EBITDA, and it impacts the PP&E on the balance sheet.
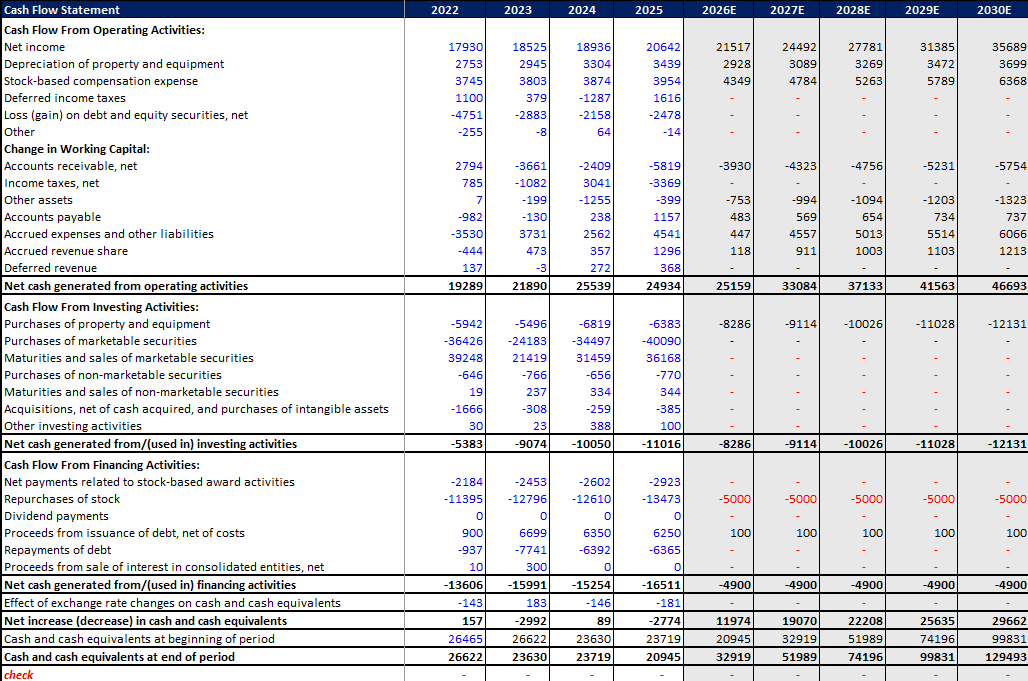
The Final Match: The cash and cash equivalents available in the balance sheet must match with the cash and cash equivalents you are getting at the end of the cash flow statement.
Detailed Step-by-Step Build Process
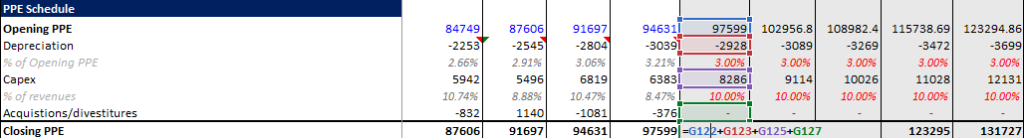
1. Forecasting the Income Statement (The Driver)
To keep the model structure as simple and reliable as possible, we follow a rigorous forecasting logic:
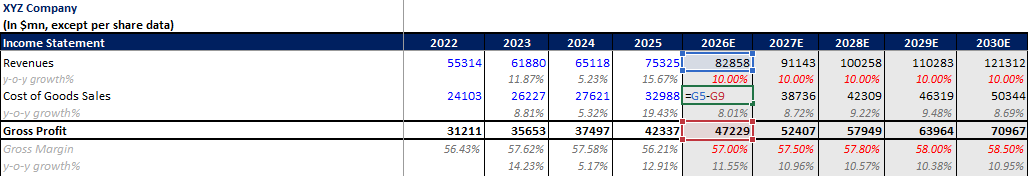
Revenue Growth: We forecasted the revenues based on YoY (Year-over-Year) growth. To maintain a realistic model, we analyzed historical trends and applied a stabilized growth rate through the 2030 forecast period. You can use our yoy calculator for calculating this growth rate.

Gross Profit & COGS: First, we calculate the Gross Margin % ($Gross Profit / Revenue$). For this model, we used a specific range between 57% to 59%.
Logic: We multiply this margin rate by the revenue number to get the Gross Profit. To get COGS, we simply deduct Gross Profit from Revenue. This “Margin-First” approach is a real-world industry standard for research analysts.
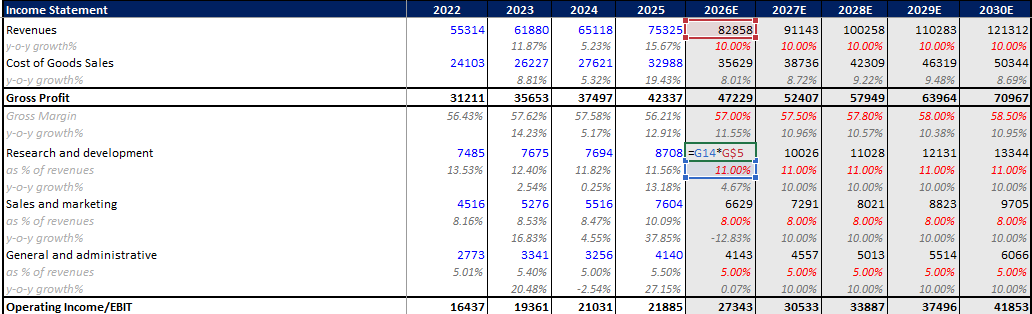
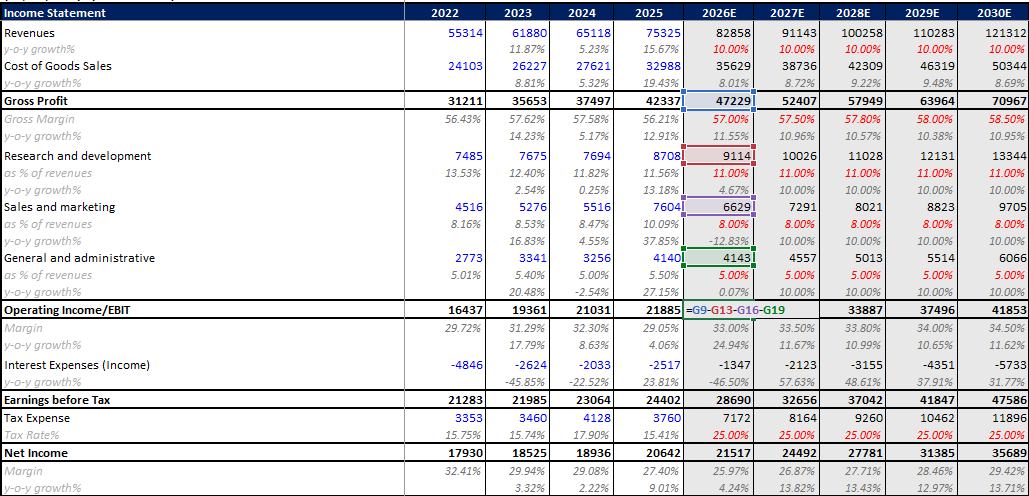
Operating Expenses (OpEx): Items like Research & Development (R&D) and Sales, General & Administrative (SG&A) were calculated as a percent of revenue. By looking at the historical average and multiplying the revenue by this percentage, we derive our future expense numbers.
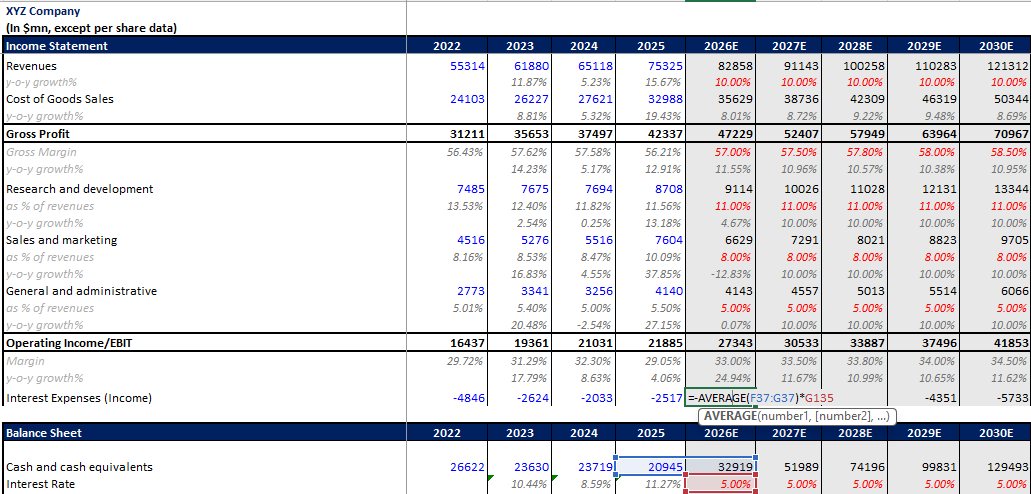
Interest Income: This is the interest getting earned on the total cash and equivalents held by the company.
Formula:$$Interest Income = \text{Average}(\text{Opening Cash Balance} + \text{Closing Cash Balance}) \times \text{Interest Rate}$$
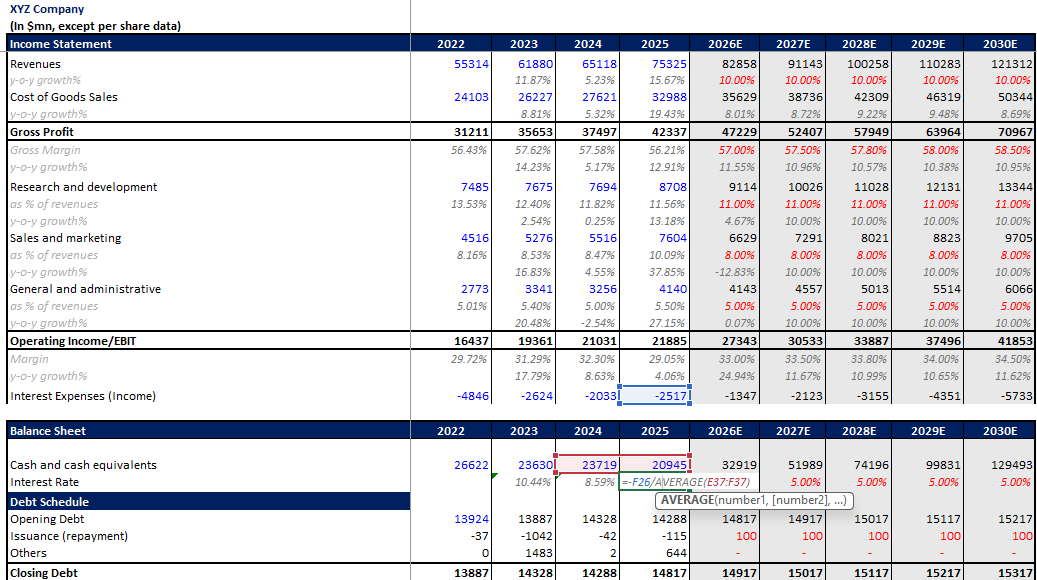
We assumed a 5% interest income for our calculations to reflect a conservative return on cash.
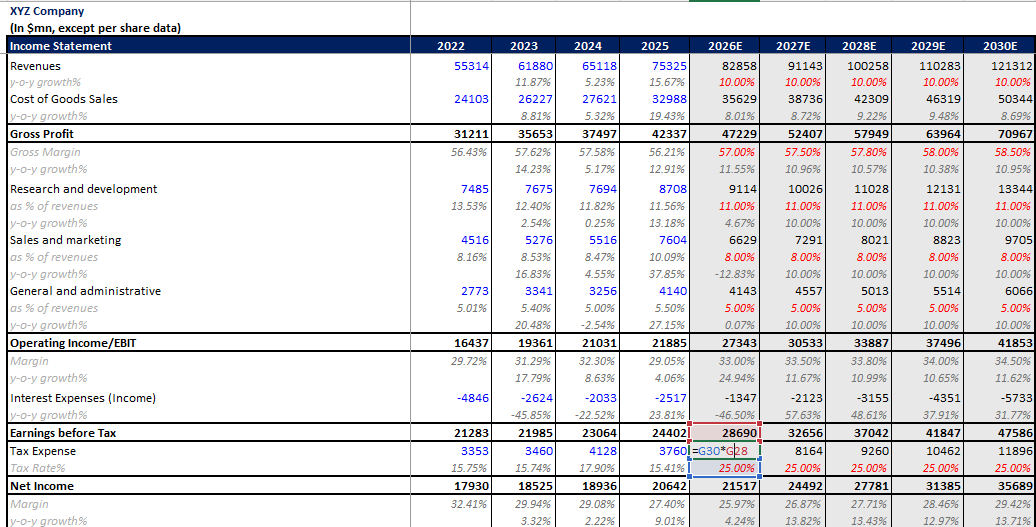
Taxes: Using a standard US corporate tax rate of 25%, we multiply this by the PBT (Earnings Before Tax) to find the tax expense.
2. The Engine Room: Building the Required Schedules
Schedules are the “working papers” that drive the Balance Sheet and Cash Flow. Without detailed schedules, your model will be “static” and prone to errors. Read our full post on “how to forecast balance sheet“.
A. The Working Capital Schedule
Working capital is all about the timing of cash. We forecast these based on efficiency ratios rather than just picking a number.
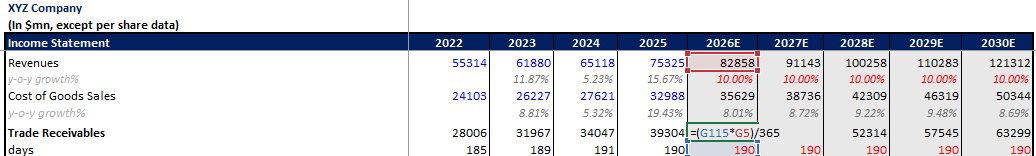
Accounts Receivable (Trade Receivables): We use DSO (Days Sales Outstanding).
- Formula:$$(Average AR / Revenue) \times 365$$
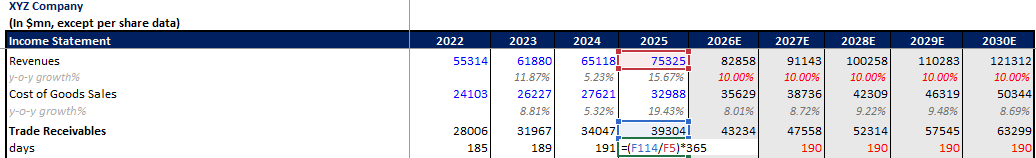
- We project the DSO based on historical performance and back-calculate the AR for the forecast years.
- Accounts Payable (Trade Payables): We use DPO (Days Payables Outstanding).
- Formula:$$(Average AP / COGS) \times 365$$
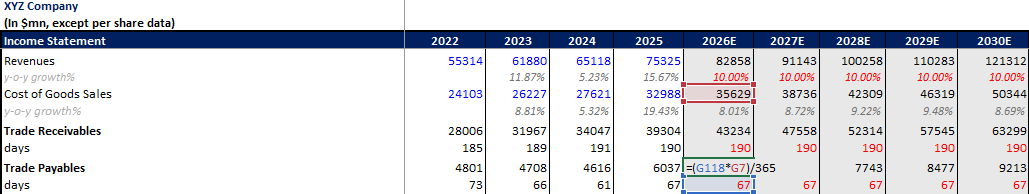
- Inventory: We use Inventory Days. This ensures that as your revenue grows, your inventory levels grow proportionally, keeping the model “logic-linked.”
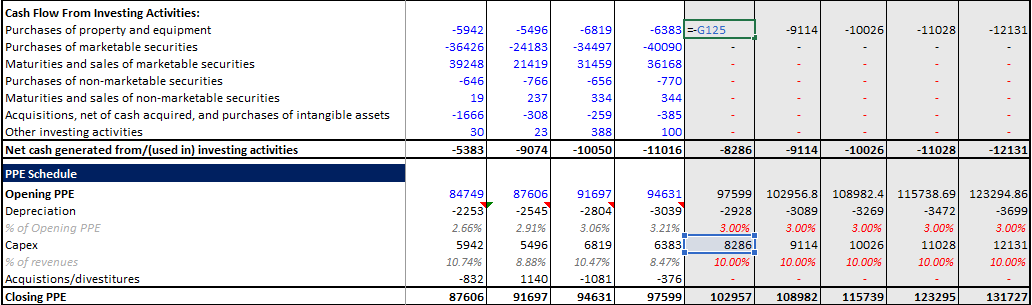
B. The PPE & Depreciation Schedule
This is often where models break. You cannot just guess the property and equipment (PP&E) balance.
Opening Balance: Take the ending balance from the previous year.
(+) Capital Expenditures (CapEx): We forecasted CapEx as a percent of revenue. This represents the money the company reinvests into itself to grow.
(-) Depreciation: This is usually calculated as a percent of the Opening PPE Balance or a percent of revenue.
(=) Closing Balance: This final number flows directly into the “Non-Current Assets” section of your Balance Sheet.
C. The Debt & Interest Schedule
If the company has debt, you need to track the principal and the cost of that debt.
Debt Drawdowns/Repayments: Linked to the Financing section of the Cash Flow.
Interest Expense: Calculated as Average Debt \times Interest Rate. This flows back to the Income Statement.

3. Building the Cash Flow Statement
This is the final “check” of the model. It is divided into three sections that reconcile the movement of cash.
Operating Activities: Start with Net Income. Add back non-cash items like Depreciation and Stock-Based Compensation (which we calculated as a percent of revenue).
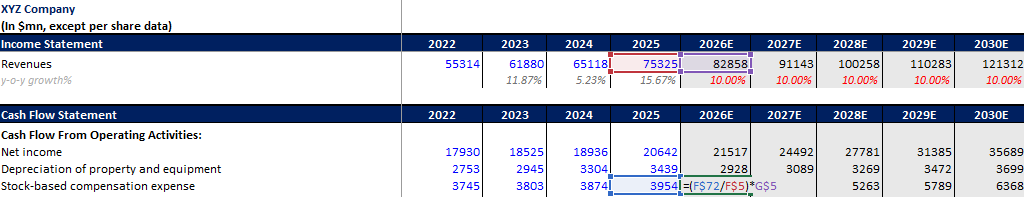
Change in Working Capital: This is the difference between years.
Manual Example: If your Accounts Receivable is 39,304 in 2025 and grew to 43,234 in 2026, that $3,930 increase is a “use of cash,” so it is subtracted in the Cash Flow statement.
Investing Activities: This includes Marketable Securities and CapEx. CapEx is taken directly from your PPE schedule.
Financing Activities: This tracks the capital structure. If the company repurchases treasury stock or issues new long-term debt, it is adjusted here.
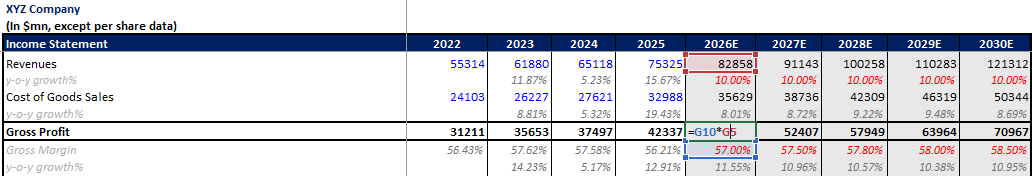
4. Professional Formatting & Common Mistakes
To make your model look like it was built by an investment banker, you must follow the Color Coding Convention included in our template:
Red Text: Forecast Assumptions (the “levers” you pull to change the model).
Blue Text: Historical Data and Hard-coded numbers (input cells).
Black Text: Formulas and Calculations (linking cells).
Common Mistakes to Avoid
Building a three-statement model is easy to start, but difficult to perfect. Even seasoned financial professionals make errors that can make a model redundant or inaccurate. Here are the most common pitfalls you should avoid to ensure your model remains reliable.
1. The Balance Sheet Not Balancing
This is the most common issue. In accounting, your Total Assets must always equal your Total Liabilities plus Equity. If they do not tally, your model is broken.
The Manual Fix: Check your Cash Flow Statement. Usually, a balance sheet doesn’t balance because a line item in the balance sheet (like Inventory or Accrued Expenses) was not correctly reflected as a “Change in Working Capital” in the Cash Flow Statement.
The Check Line: Always include a “Check” row at the very bottom of your Balance Sheet with the formula: =Total Assets - (Total Liabilities + Total Equity). If this is not zero, stop and fix it before moving forward.
2. Hard-Coding vs. Linking
A “hard-code” is a number typed directly into a cell that should be a formula. This is a nightmare for financial industry professionals.
The Issue: if you hard-code your Gross Profit instead of linking it to Revenue \times Gross Margin, your model won’t update when you change your revenue assumptions.
The Rule: Only the historical data and the specific red-highlighted assumptions should be hard-coded. Everything else—every single subtotal and forecast—must be a formula.
3. Ignoring Restated Data
When gathering historical data for a US public listed company from the SEC website or 10K filings, look out for Restated Data.
Why it matters: Companies often change their accounting methods or restructure their business. If you use the original 2024 data from a 2024 report, but the 2025 report shows “restated” 2024 numbers, always use the restated version. It is more accurate and reflects the current state of the business logic.
4. Circular Reference Traps
In high-level modeling, Interest Income depends on the Ending Cash Balance, but the Ending Cash Balance depends on the Interest Income you earned. This creates a “Circular Reference.”
The Solution: In our template, we use a “Circ-Breaker” or simple average logic to prevent Excel from crashing. Always ensure your interest calculations are linking to the average of opening and closing balances to stay consistent with the financial industry standards.
Download Your Free Excel Template
We are providing you with a free, professional-grade Excel template so that you don’t have to worry about the structure and can focus purely on the analysis. This template has been prepared by financial professionals with over 5+ years of experience in equity research and investment banking.
What is included in this template?
Full Three Statements: Cleanly laid out Income Statement, Balance Sheet, and Cash Flow Statement.
Integrated Schedules: Pre-built schedules for PPE (Property, Plant, and Equipment), Working Capital (DSO/DPO logic), and Debt.
Automated Linkages: Every statement is already interlinked. When you change a revenue assumption, the entire model—including the cash flow—updates automatically.
Professional Formatting: We have followed the strict financial industry color-coding:
- BLUE: Historical data and inputs (Hard-coded).
- RED: Forecast assumptions (The “Levers” you change).
- BLACK: Formulas and calculations (Do not touch these!)
How to use it: Start by filling in the blue cells with the historical data of the company you are interested in. Then, move to the red cells in the “Assumptions” tab to set your growth rates and margins. Watch as the model builds itself!
Conclusion
Building a three-statement financial model is not just about Excel formulas; it is about understanding the “story” of a business through its numbers. By mastering the linkages between the Income Statement, Balance Sheet, and Cash Flow Statement, you gain the ability to value any company in the world—whether it’s a startup or a global giant.
We have covered everything from the basic definitions to the complex logic of PPE schedules and working capital adjustments. This guide, combined with our free template, gives you the exact blueprint used by professionals in investment banking and corporate finance.
Key Takeaways:
- Always start with the Income Statement and move through the Schedules before finishing the Balance Sheet.
- Ensure your model is dynamic by linking every statement.
- Use the “Check” line to make sure your Balance Sheet always balances.
We hope this guide helps you in your journey of learning financial modeling. This content is for educational and informational purposes, and we encourage you to practice by plugging in data for different companies to see how their “finance logic” differs.
The tutorials, resources, financial models, and Excel templates provided by Finance With Logic are strictly for educational and informational purposes. They do not constitute professional financial, legal, tax, or investment advice. Financial forecasting involves inherent risks and assumptions. Please consult with a certified financial advisor, CPA, or registered broker before making any real-world investment decisions, executing trades, or finalizing corporate capital allocations based on these materials. Use of these models is at your own risk.
FAQ
It is basically concerned with three financial statements: the Income Statement, Balance Sheet, and Cash Flow Statement. These are considered the three most important financial statements in the financial industry.
To build a 3-statement financial model, you must first gather at least two years of historical data from filings like the 10-K. The process follows a specific order: start with the Income Statement to forecast profitability, then move to Schedules for working capital and fixed assets (PP&E). These schedules drive the Balance Sheet line items. Finally, construct the Cash Flow Statement, which pulls from the previous two. The model is only complete when the “Ending Cash” from the cash flow perfectly matches the cash on the balance sheet, ensuring the entire system is interlinked and balanced.


Leave a Reply