
If you are analyzing a business, building a financial model, or simply trying to understand a company’s recent earnings report, you are going to run into one metric constantly: Year-over-Year growth.
Often abbreviated as YoY, this metric is a staple in the financial industry. But what exactly does it mean, why does everyone from Wall Street analysts to local business owners use it, and how do you calculate it correctly?
In this comprehensive guide, we will break down everything you need to know about Year-over-Year growth, complete with formulas, real-world examples, and a comparison against other common time-based metrics like QoQ and MoM.
What is Year-Over-Year (YoY) Growth?
Year-over-Year (YoY) growth measures the percentage change in a specific metric over two comparable periods spanning a 12-month timeframe.
Simply put, it compares how a business performed in a specific period this year versus the exact same period last year.
For example, if today is January 1, 2026, and we want to calculate the YoY growth of a company’s annual sales, we would compare the data from January 1, 2025, to the data from January 1, 2026. This apples-to-apples comparison gives us a clear picture of whether a business is expanding, contracting, or remaining stagnant.
Instead of looking at absolute values (e.g., “We made $20 million more this year”), investors and stakeholders prefer to see percentage changes (e.g., “We grew our revenue by 20%”). Percentages provide immediate context. A $20 million increase is massive for a small startup, but it’s a rounding error for a trillion-dollar tech giant. YoY growth calculator levels the playing field, making the data universally understandable.
Why the Financial Industry Relies on YoY Growth
If you are working in the financial sector—or planning to break into it—understanding YoY growth is non-negotiable. Whether you are an investment banker, a corporate finance professional, a CPA, or a buy-side analyst, this metric is part of your daily vocabulary.
Here is why the industry heavily relies on it:
- Standardized Benchmarking: It allows analysts to compare the recent financial performance of a company against its historical performance in a standardized way.
- Contextualizing Absolute Numbers: Let’s say a company generated $100 million in revenue in December 2024. In December 2025, its revenue increased to $120 million. Telling investors “we generated $20 million more” doesn’t sound nearly as professional or clear as saying “we achieved a 20% YoY revenue growth.”
- Earnings Reports and Filings: Look at any public company’s quarterly or annual filings (like a 10-K or 10-Q). Management usually highlights YoY growth rates in the very first paragraph because it is the quickest way to summarize their performance for shareholders.
How to Calculate YoY Growth: The YoY Formula
Calculating YoY growth is straightforward. It doesn’t require complex calculus; it just requires two accurate data points.
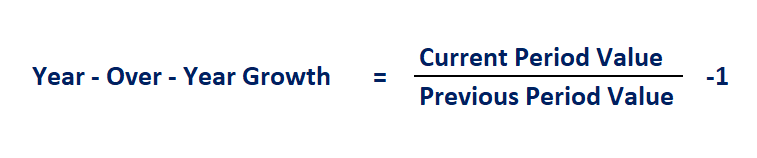
Here is the primary formula used by financial analysts:
$$\text{YoY Growth} = \left( \frac{\text{Current Period Value}}{\text{Previous Period Value}} \right) – 1$$
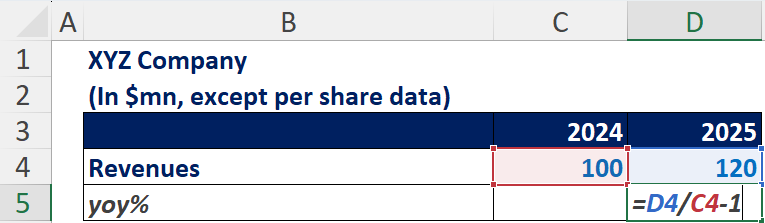
Let’s apply this formula to our previous example. A company has $100 million in revenue in 2024 and $120 million in 2025.
- Divide the current year ($120 million) by the previous year ($100 million), which gives you 1.20.
- Subtract 1 from 1.20, leaving you with 0.20.
- Convert to a percentage, and you have a 20% growth rate.
The Alternative Formula
There is a second way to calculate this, which you might see in some textbooks:
$$\text{YoY Growth} = \frac{\text{Current Period Value} – \text{Previous Period Value}}{\text{Previous Period Value}}$$
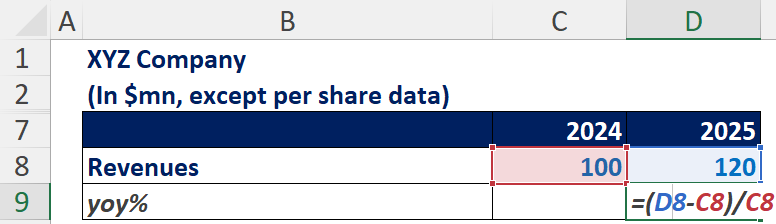
While this formula is mathematically identical and will give you the exact same result, we highly recommend using the first formula, especially if you are working in Excel.
Why? Efficiency. The second formula requires three linkages in your Excel spreadsheet (Current Period, minus Previous Period, divided by Previous Period). The first formula only requires two linkages. When you are building massive financial models and dragging formulas across hundreds of columns, that slight reduction in complexity saves time and reduces the risk of referencing errors.
A Realistic YoY Calculation Example
Let’s look at a realistic scenario involving quarterly revenue to see how this works in practice.
Imagine you are analyzing a mid-sized software company.
- Q1 2025 Revenue: $100 million
- Q1 2026 Revenue: $150 million
To find the YoY growth for the first quarter, we plug the numbers into our preferred formula:
$$\text{YoY Growth} = \left( \frac{150,000,000}{100,000,000} \right) – 1$$
This calculates to 1.5 – 1, which equals 0.50.
Therefore, the company experienced a 50% YoY growth rate for Q1. This is a massive positive signal for investors, indicating that the company is successfully scaling its operations, generating more revenue, and likely increasing profits.
The Key Advantages: Why YoY is the Superior Metric
Why is YoY discussed so prominently on financial news websites and daily market updates? Because it solves one of the biggest problems in financial analysis: Seasonality.
Removing the Seasonality Effect
Most businesses do not earn their revenue evenly throughout the year. A retail company, for example, will almost always see a massive spike in sales during the Q4 holiday season (November and December).
If that retailer compares their Q4 sales to their Q1 sales (the slow months after the holidays), it will look like their business is collapsing. That comparison is useless because the periods aren’t comparable.
YoY growth completely removes the seasonal impact. By comparing Q4 2025 to Q4 2024, you are comparing two holiday seasons against each other. This strips out the “noise” of seasonal benefits and tells you the true underlying growth trend of the business.
Filtering Out Short-Term Noise
Markets are volatile. A single news event, a brief supply chain hiccup, or an unexpected global event can tank a single month’s numbers. YoY stretches the timeline out just enough to smooth over short-term panic, giving stakeholders a realistic view of long-term trajectory.
YoY vs. QoQ vs. MoM: Understanding the Differences
If you are building a financial model, you will likely track multiple timeframes. The three most common are YoY, QoQ, and MoM. Here is how they stack up against each other:
| Metric | Stands For | What It Compares | Best Used For |
| YoY | Year-over-Year | The current period vs. the exact same period 12 months ago. | Long-term tracking, eliminating seasonality, analyzing overall business health. |
| QoQ | Quarter-over-Quarter | The current quarter vs. the immediately preceding quarter (e.g., Q2 vs. Q1). | Tracking short-term growth and immediate operational changes. |
| MoM | Month-over-Month | The current month vs. the immediately preceding month. | High-frequency tracking, monitoring very recent trends or ad campaigns. |
While MoM and QoQ are great for high-frequency internal tracking, YoY is generally considered the gold standard for external reporting because it provides the most realistic, noise-free view of a company’s trajectory.
Key Financial Line Items to Track YoY
You can calculate YoY growth for virtually any line item in a business. However, if you are conducting standard financial analysis, these are the critical areas where YoY growth must be calculated:
- Revenue Growth: The most common use case. Are sales increasing compared to last year?
- Net Profit/Income Growth: It is great to grow revenue, but are the actual profits growing YoY as well? If revenue is up 20% YoY but profits are down 5% YoY, the company has an expense problem.
- EBITDA: Crucial for understanding operational profitability before accounting and tax impacts.
- Macroeconomic Indicators: Economists use YoY to track GDP growth and Inflation rates. Comparing inflation YoY is the standard way central banks measure the cost of living changes.
By applying YoY growth to these specific segments, it becomes much easier to identify exactly where a company is excelling and where it is bleeding cash.
Using YoY Growth in Financial Modeling
If you are a financial analyst, the YoY growth rate is the engine of your financial model. You will apply it across almost every line item in an Income Statement.
Forecasting the Future
Financial modeling relies heavily on historical data to predict the future. You cannot accurately project a company’s revenue for the next five years if you don’t know its historical YoY growth rate.
Typically, an analyst will look at the last 3 to 5 years of YoY growth. If a company has consistently grown its revenue by 8% YoY, the analyst might use that 8% (or a slightly adjusted figure based on market conditions) as the assumed growth rate for their future forecasts.
Valuations
Your entire valuation model (like a Discounted Cash Flow analysis) relies on these forecasts. If your baseline historical YoY growth calculations are wrong, your future projections will be wrong. Consequently, your final valuation of the company will be entirely unrealistic.
A reliable model grounds its future estimates in accurate historical YoY data.
Conclusion
Understanding Year-over-Year growth is fundamental to financial literacy. It is the cleanest, most efficient way to communicate how a business is performing without getting bogged down by seasonal anomalies or the noise of short-term volatility.
Whether you are checking a stock’s earnings report or building a massive 3-statement model in Excel, mastering the YoY formula—and understanding exactly when and why to use it—is a critical skill.
FAQ
Year-over-Year (YoY) growth measures the percentage change in a specific metric over two comparable periods spanning a 12-month timeframe.
Here is the primary formula used by financial analysts:
YoY Growth=(Current Period ValuePrevious Period Value)–1
YoY stands for Year over Year growth rate


Leave a Reply